Configure SigLens as a Prometheus Data Source in Grafana
This guide will walk you through the process of adding SigLens as a Prometheus data source in Grafana and set up dashboard using the data source.
Before You Begin
Prerequisites:
- A running SigLens instance collecting metrics
- Access to your Grafana installation
- Prometheus metrics flowing into SigLens
Add SigLens as a Data Source
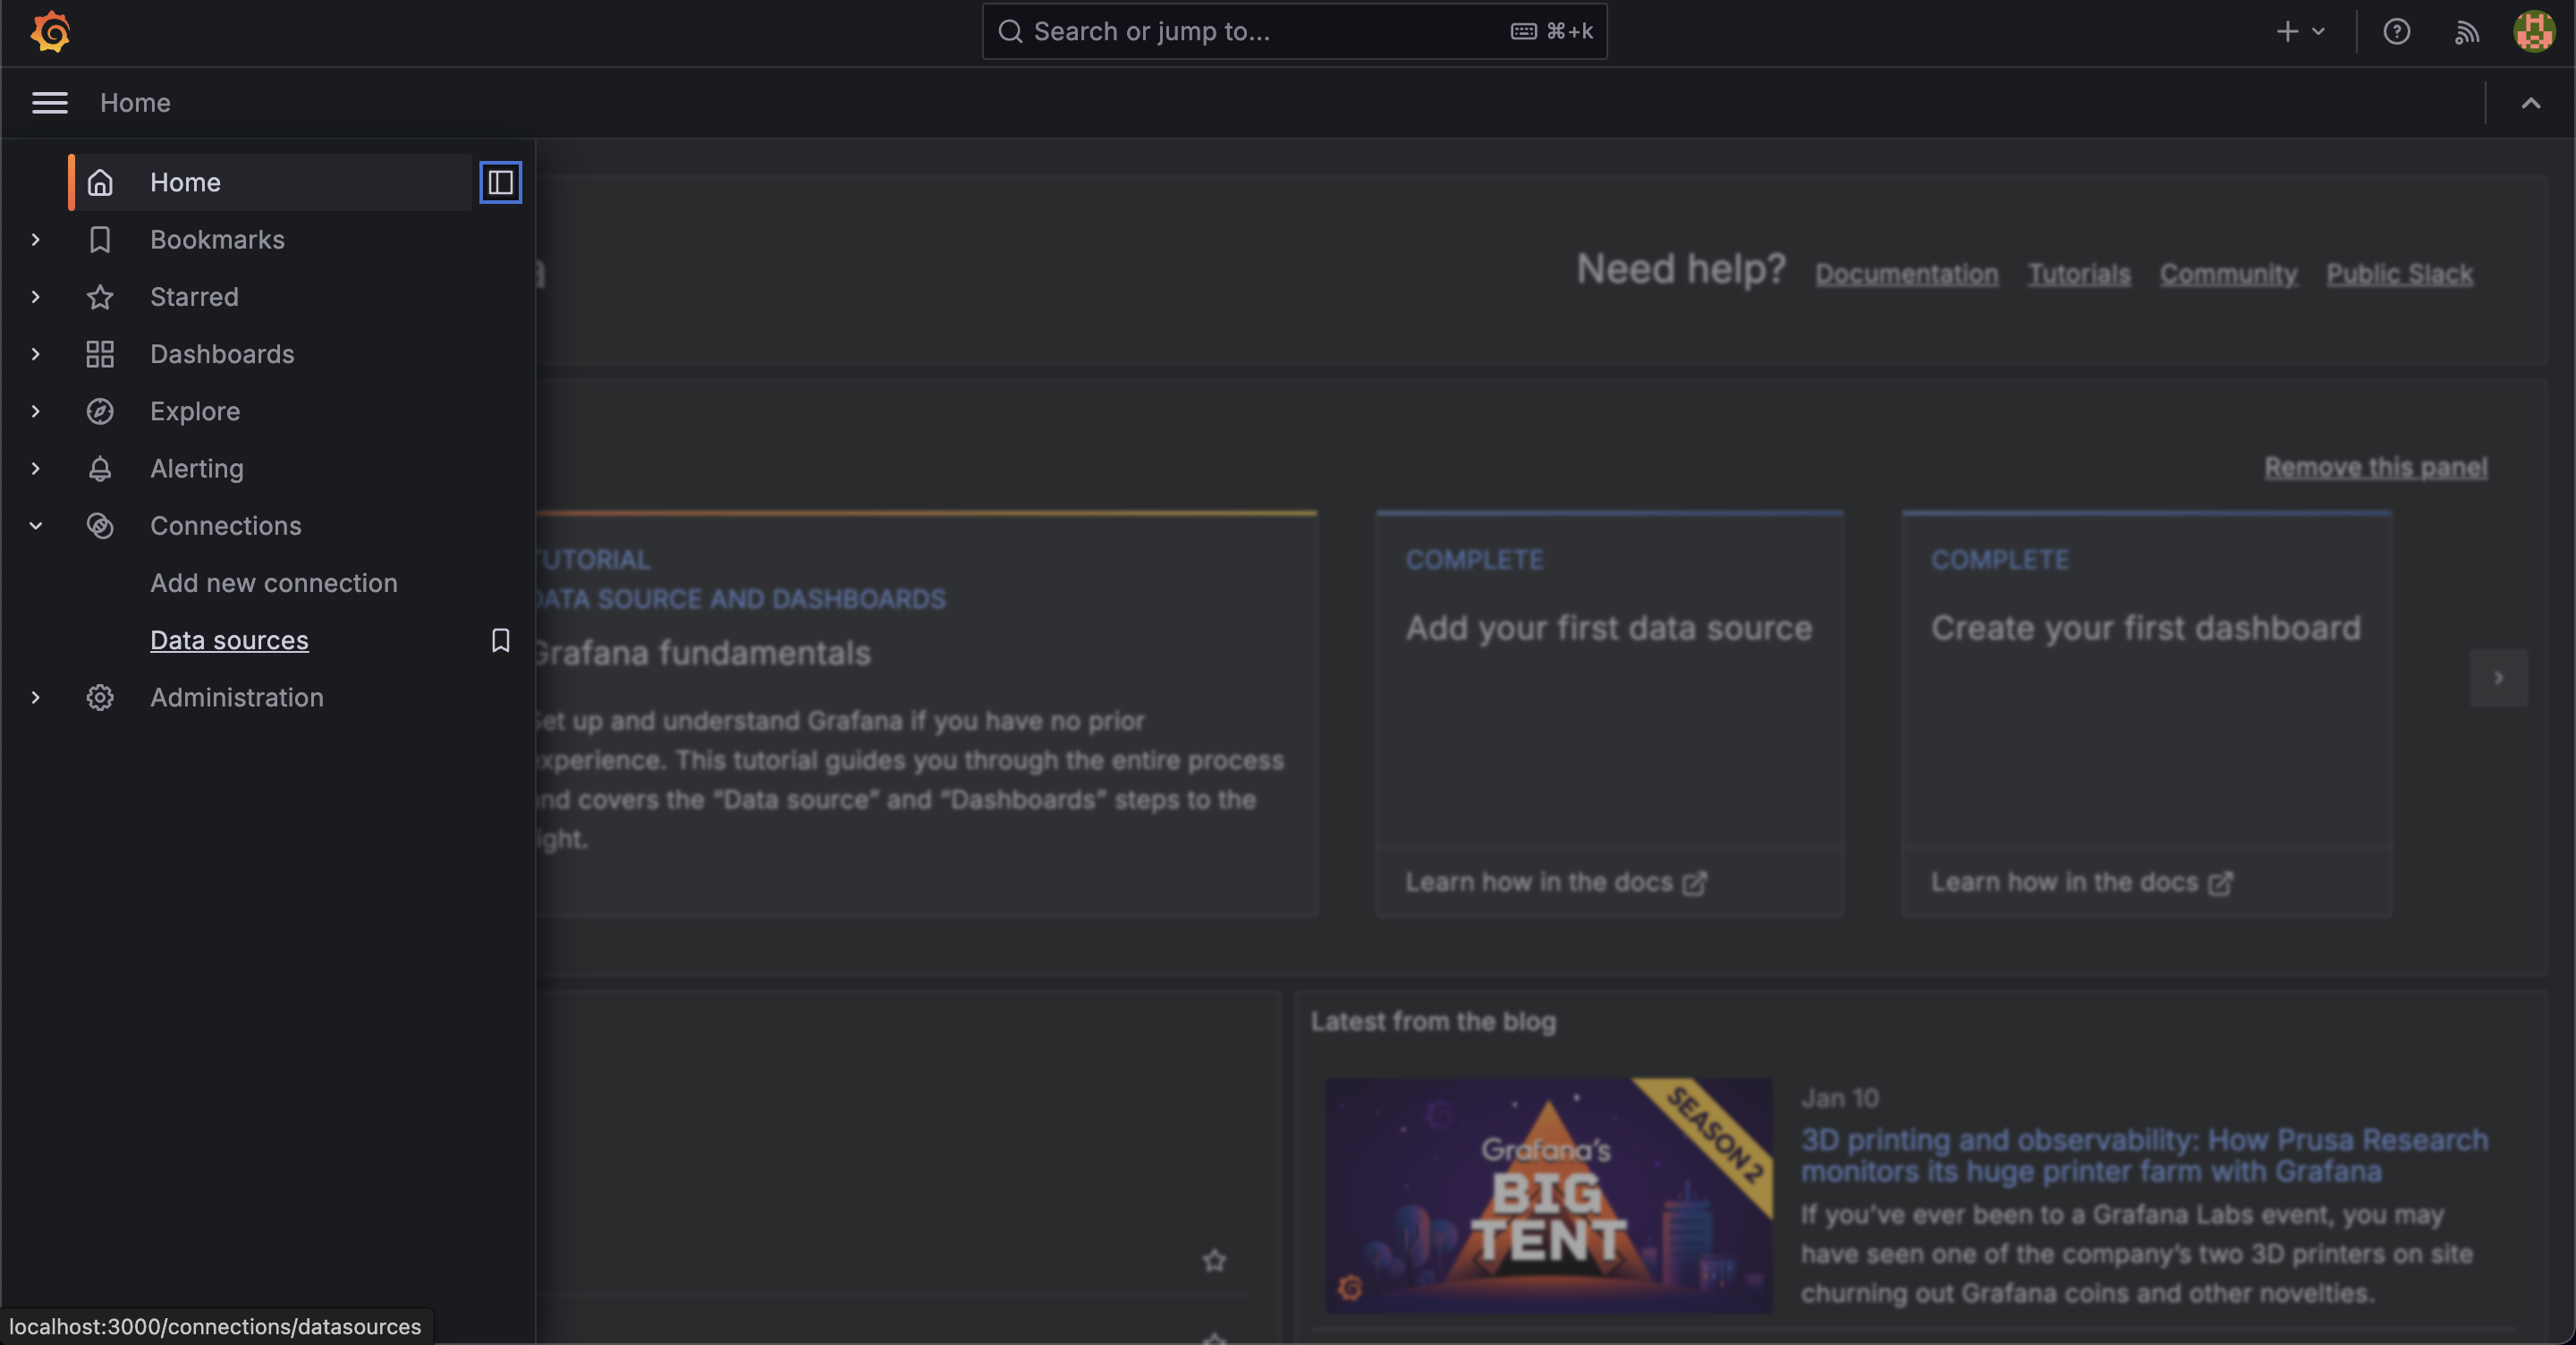
1. Navigate to Data Sources
In the Grafana sidebar, navigate to "Connections" → "Data sources"
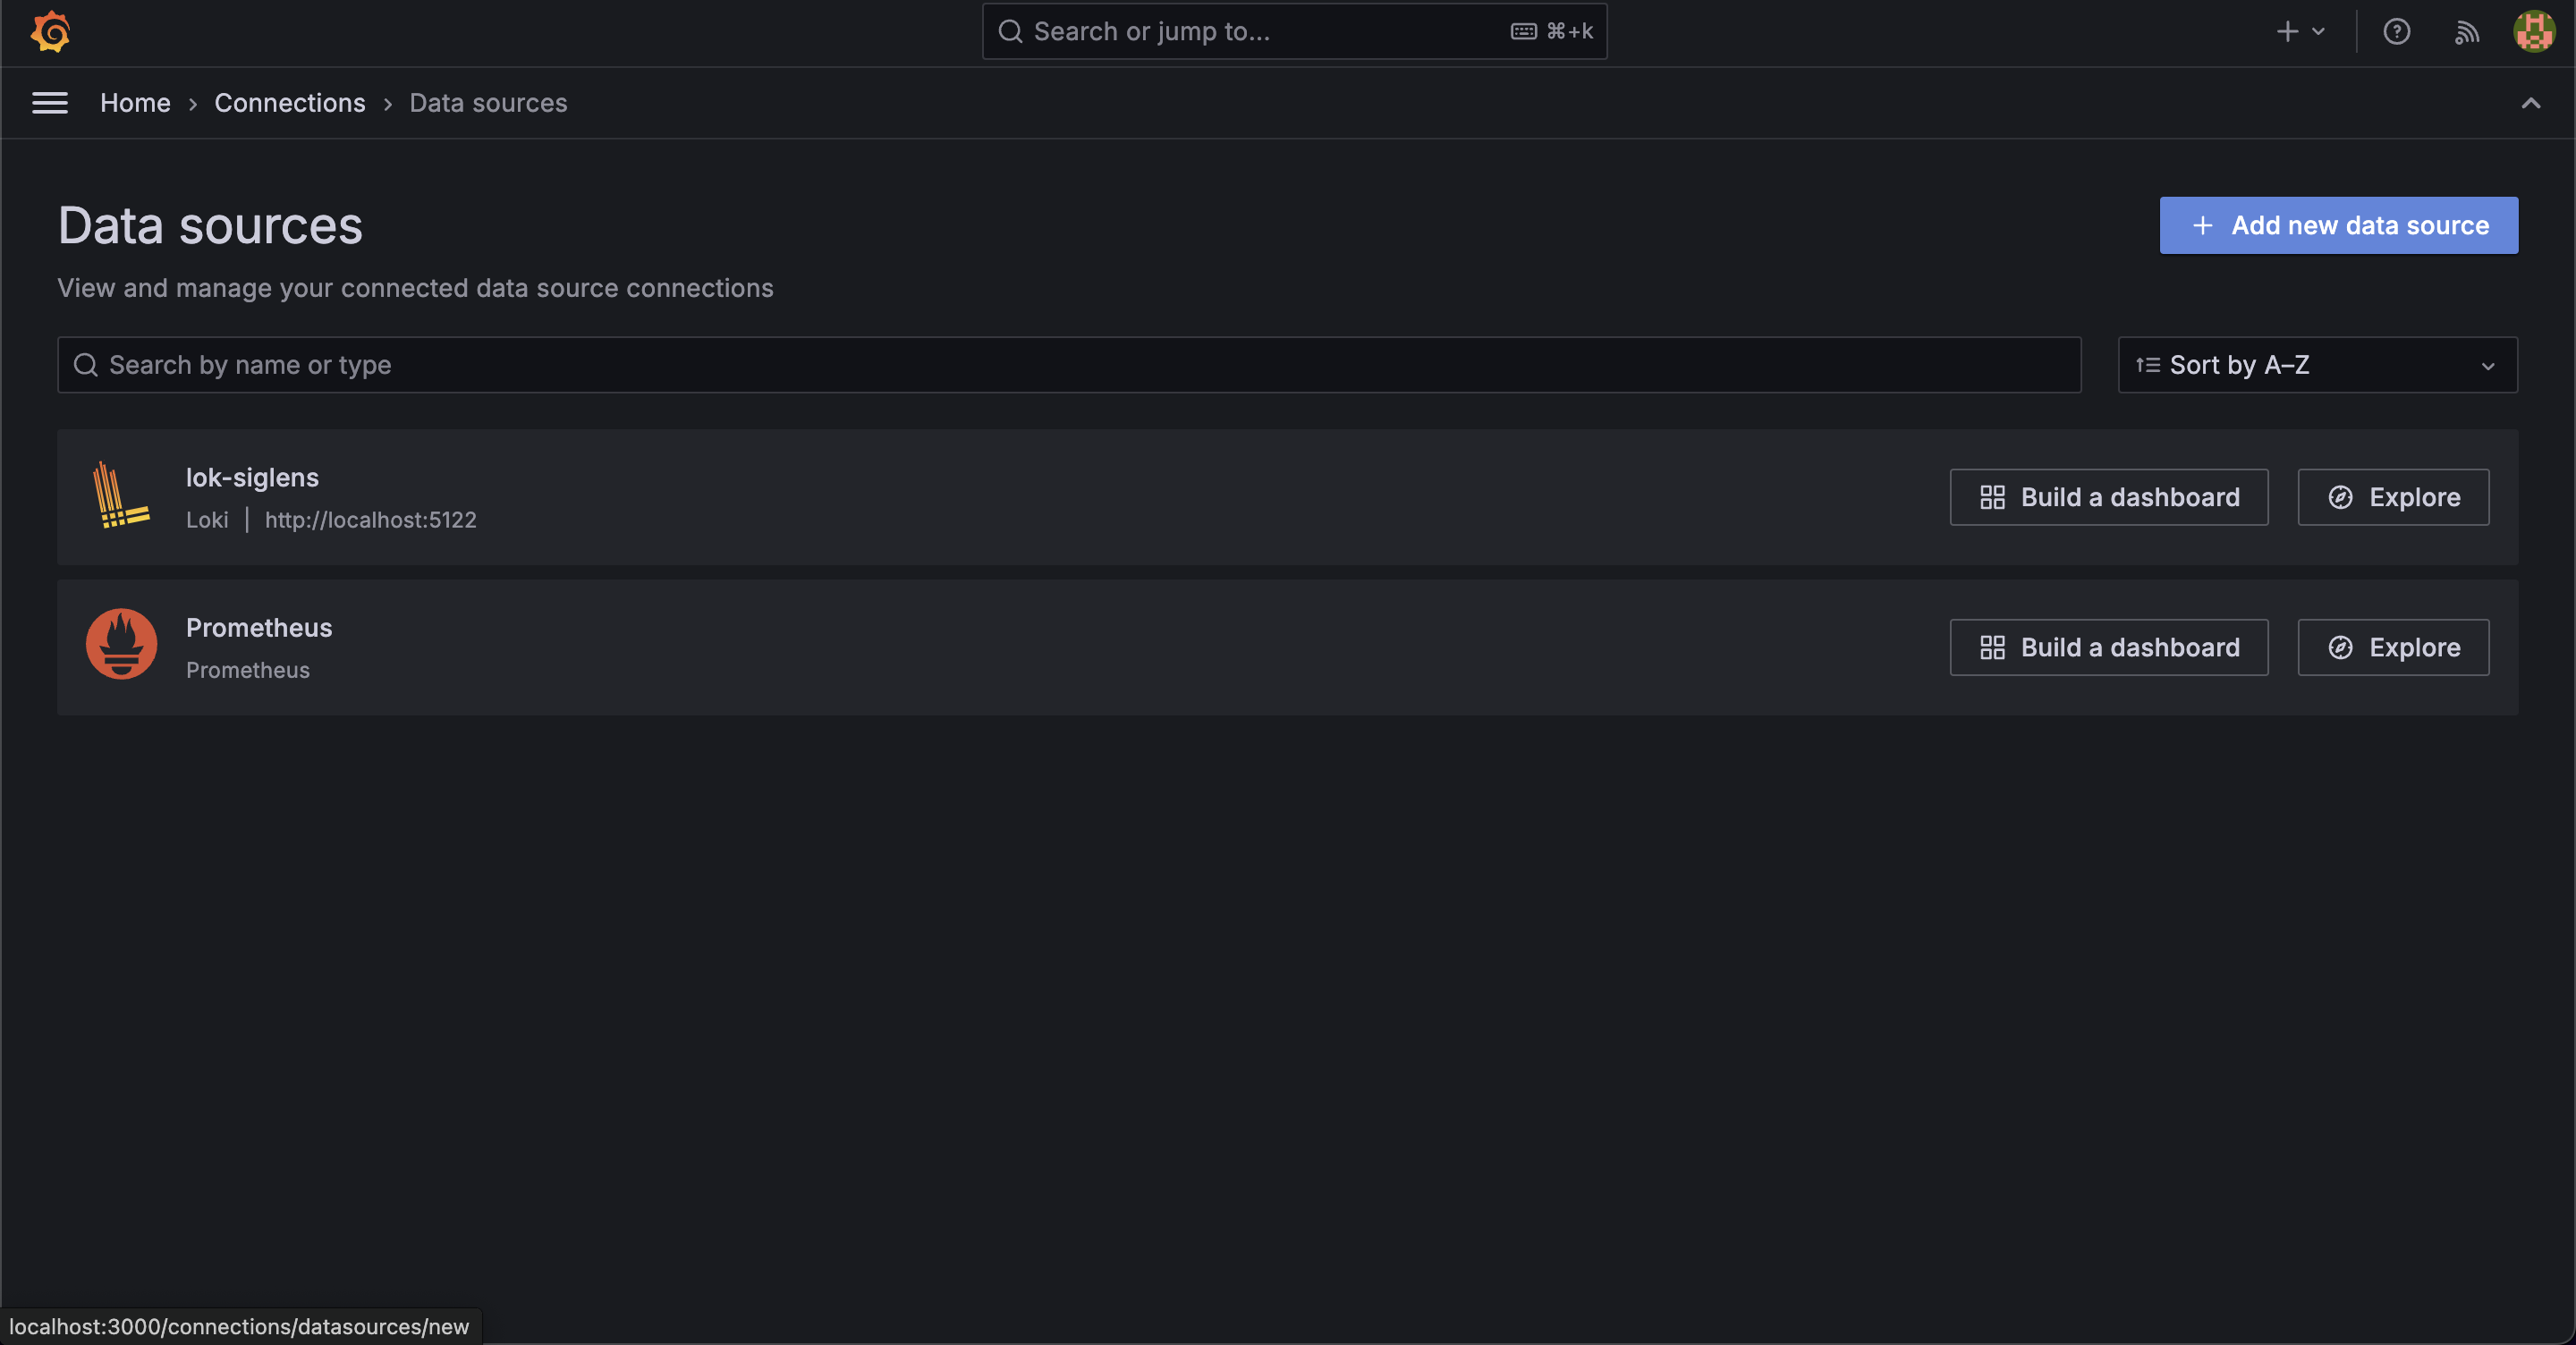
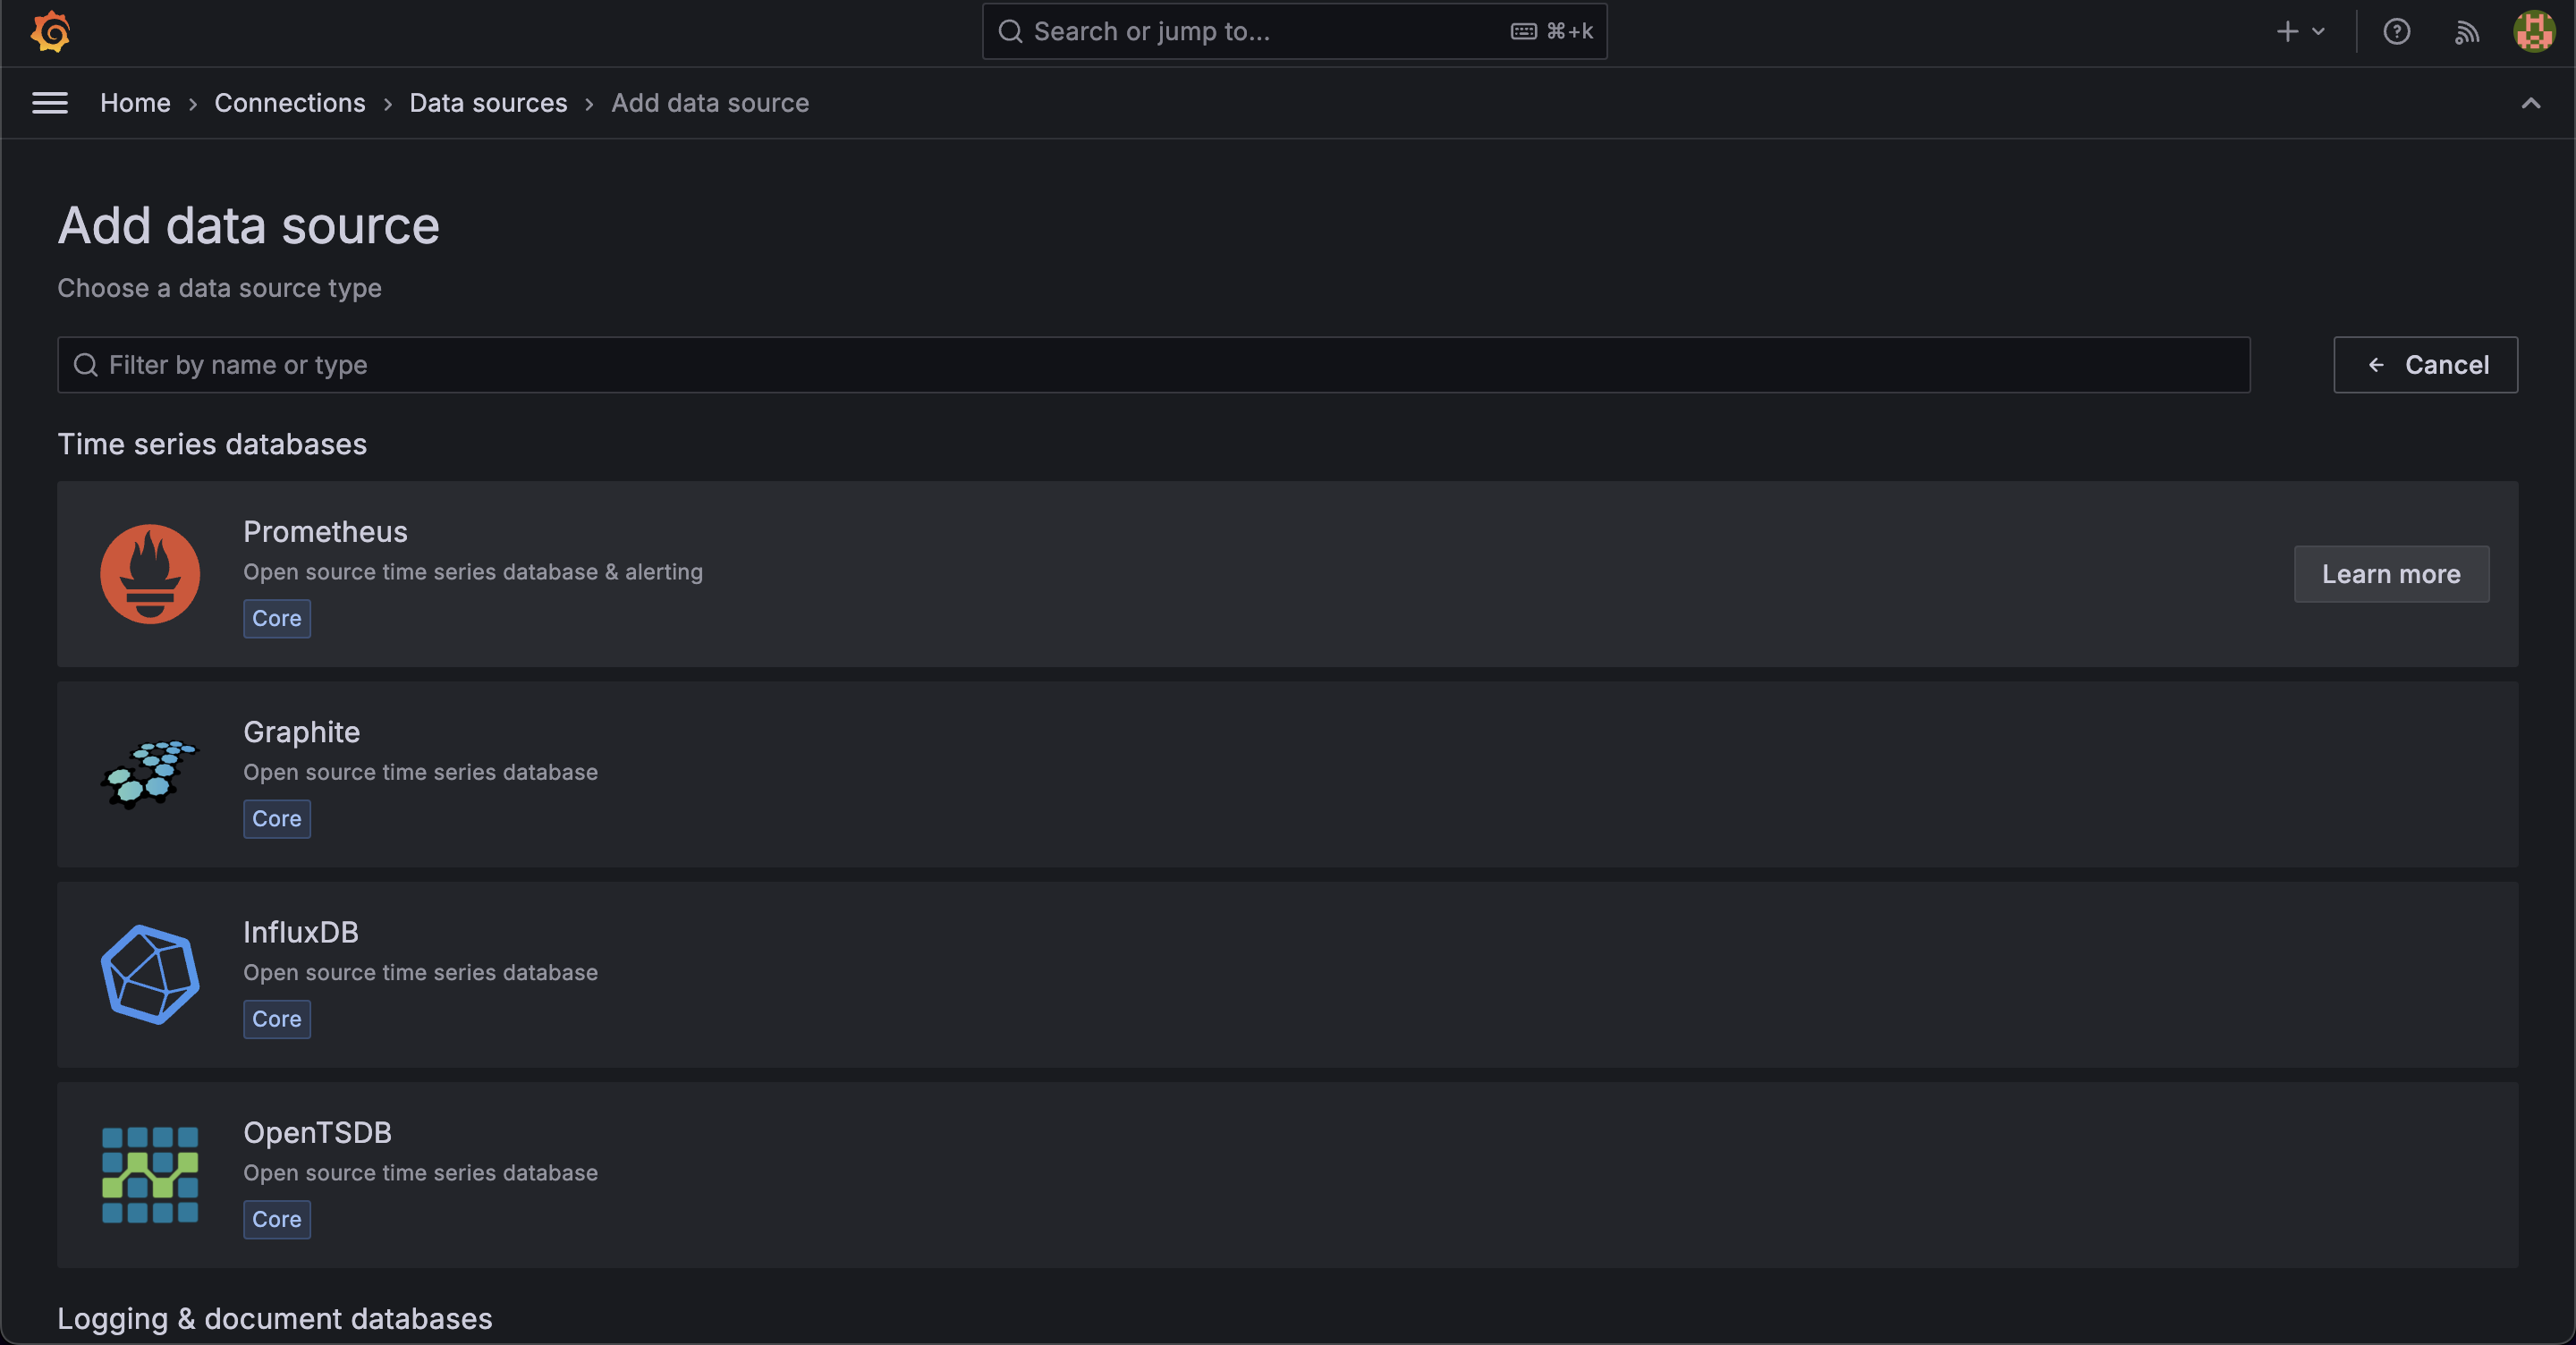
2. Add Prometheus Data Source
- Click "Add new data source" button at the top of the page
- In the search box, type "Prometheus" to filter the options
- Select the "Prometheus"
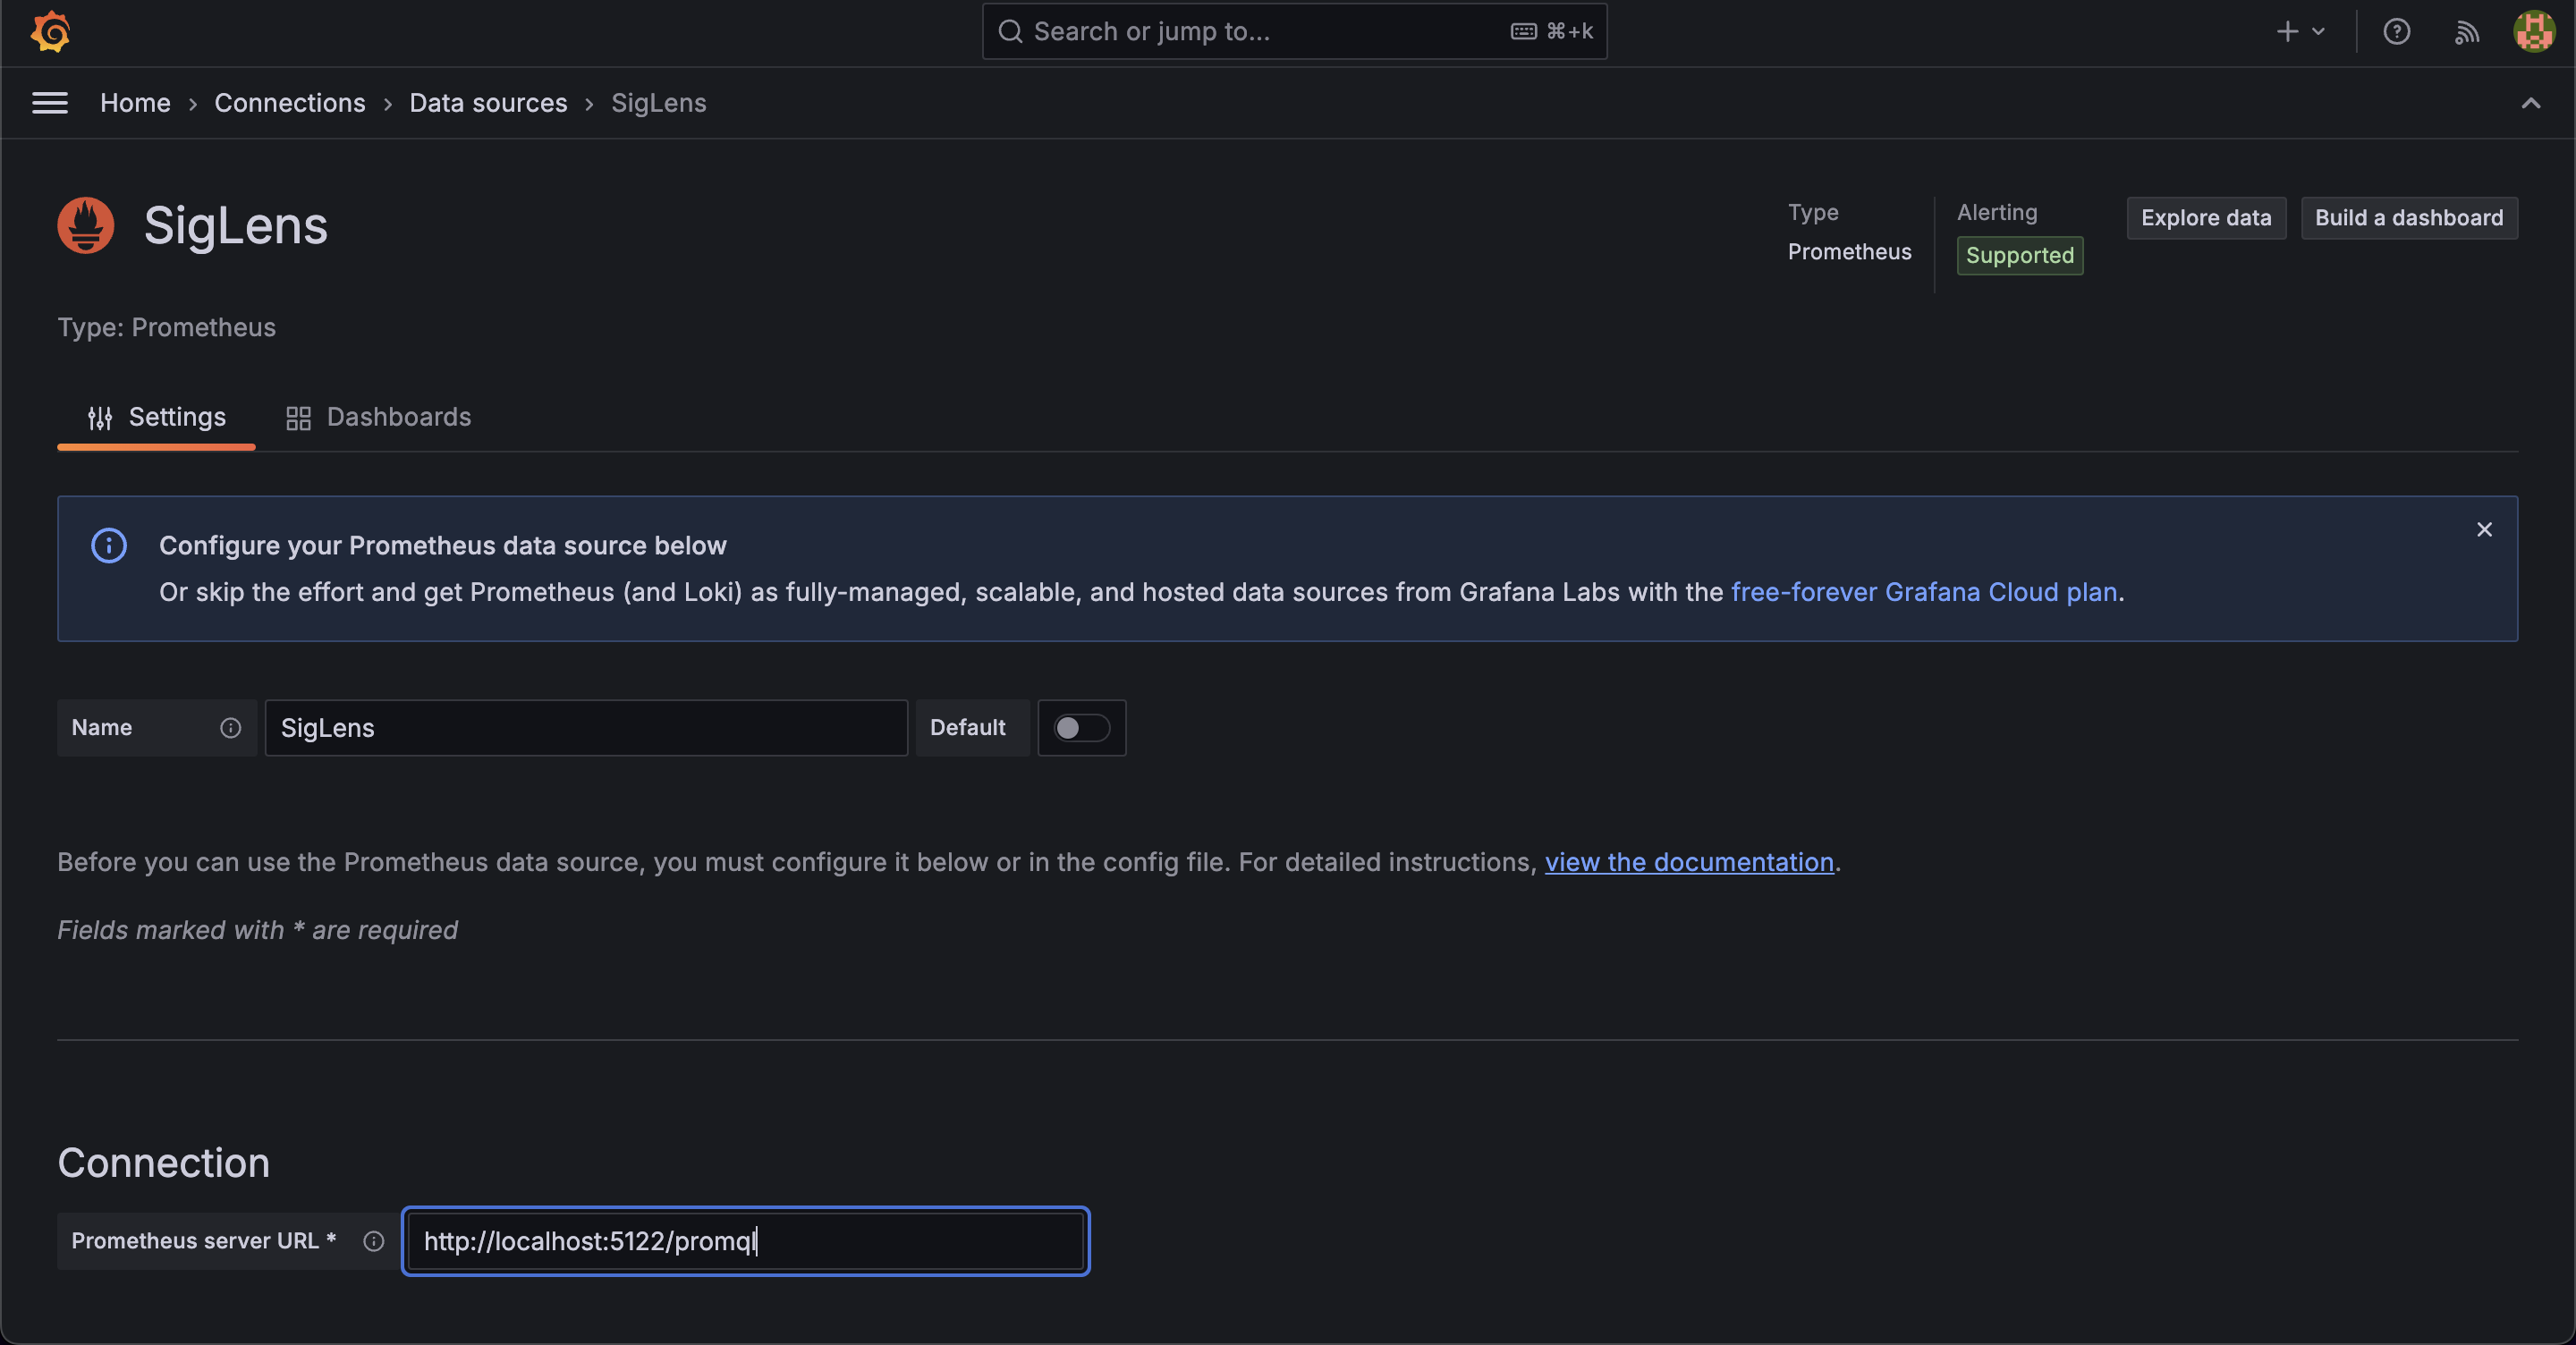
3. Configure SigLens Connection
Enter the following configuration details:
-
Basic Configuration:
- Name:
SigLens(or your preferred name) - URL:
http://localhost:5122/promql(adjust if using a different port)
- Name:
-
Scroll down to the bottom and click "Save & test"
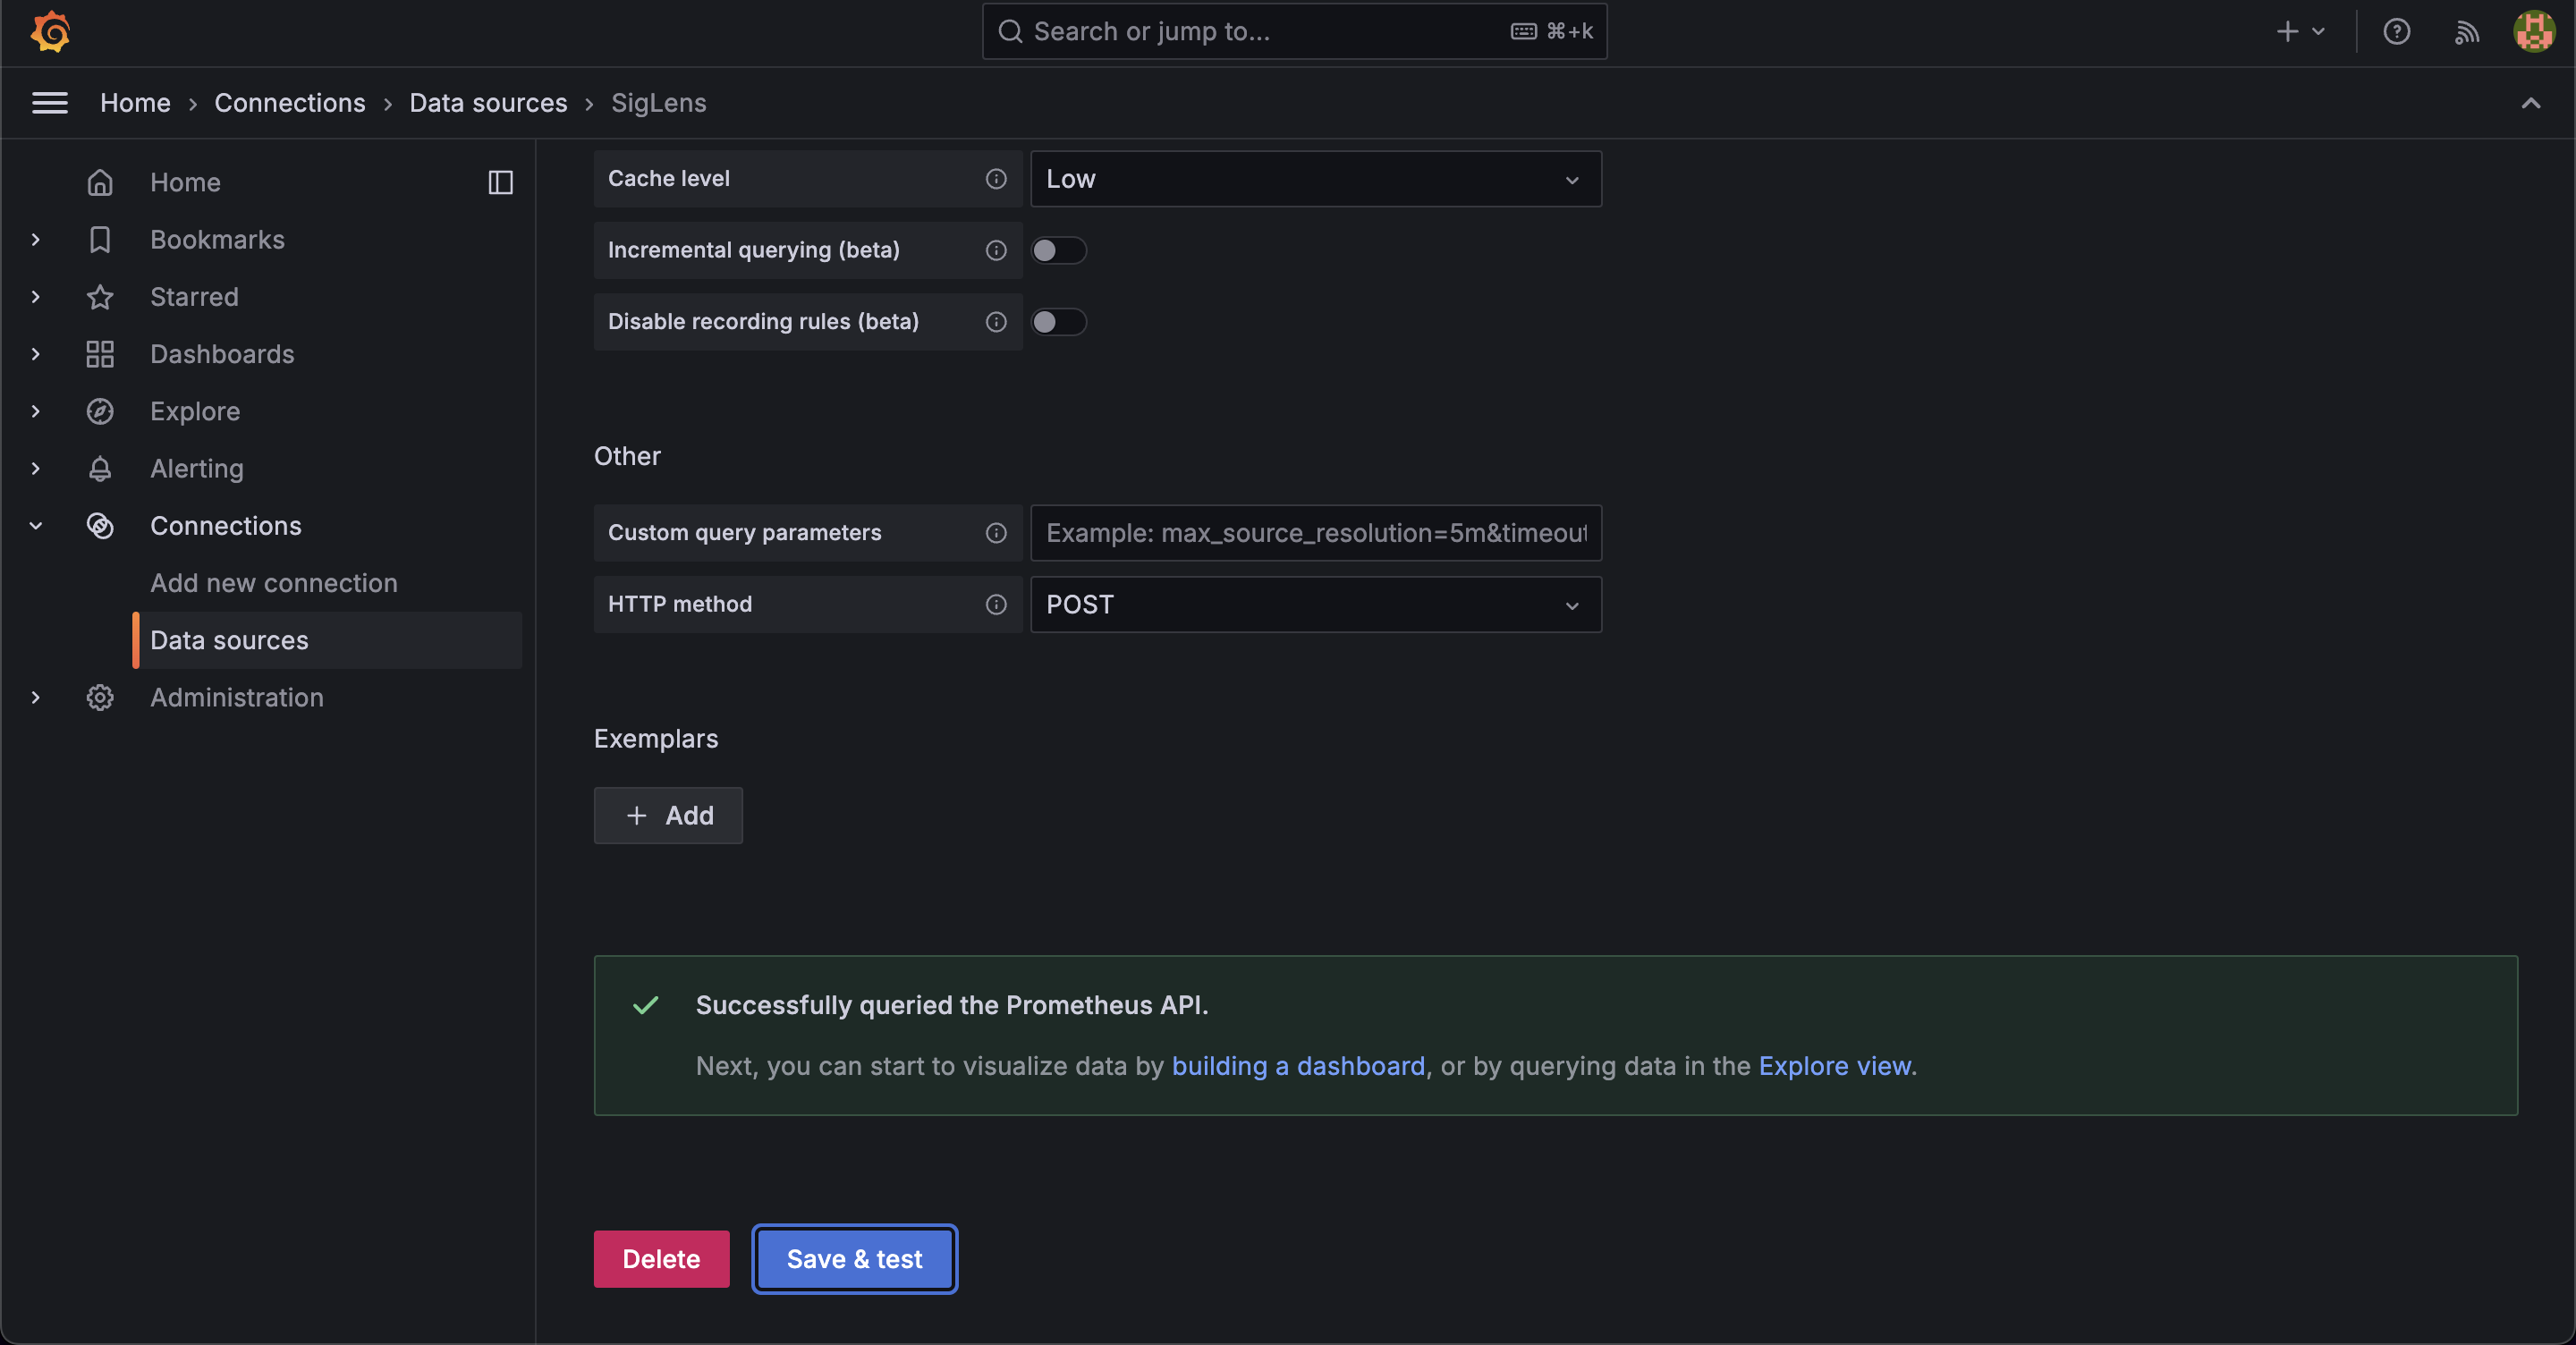 Upon successful connection, you'll see a green confirmation message.
Create Dashboard
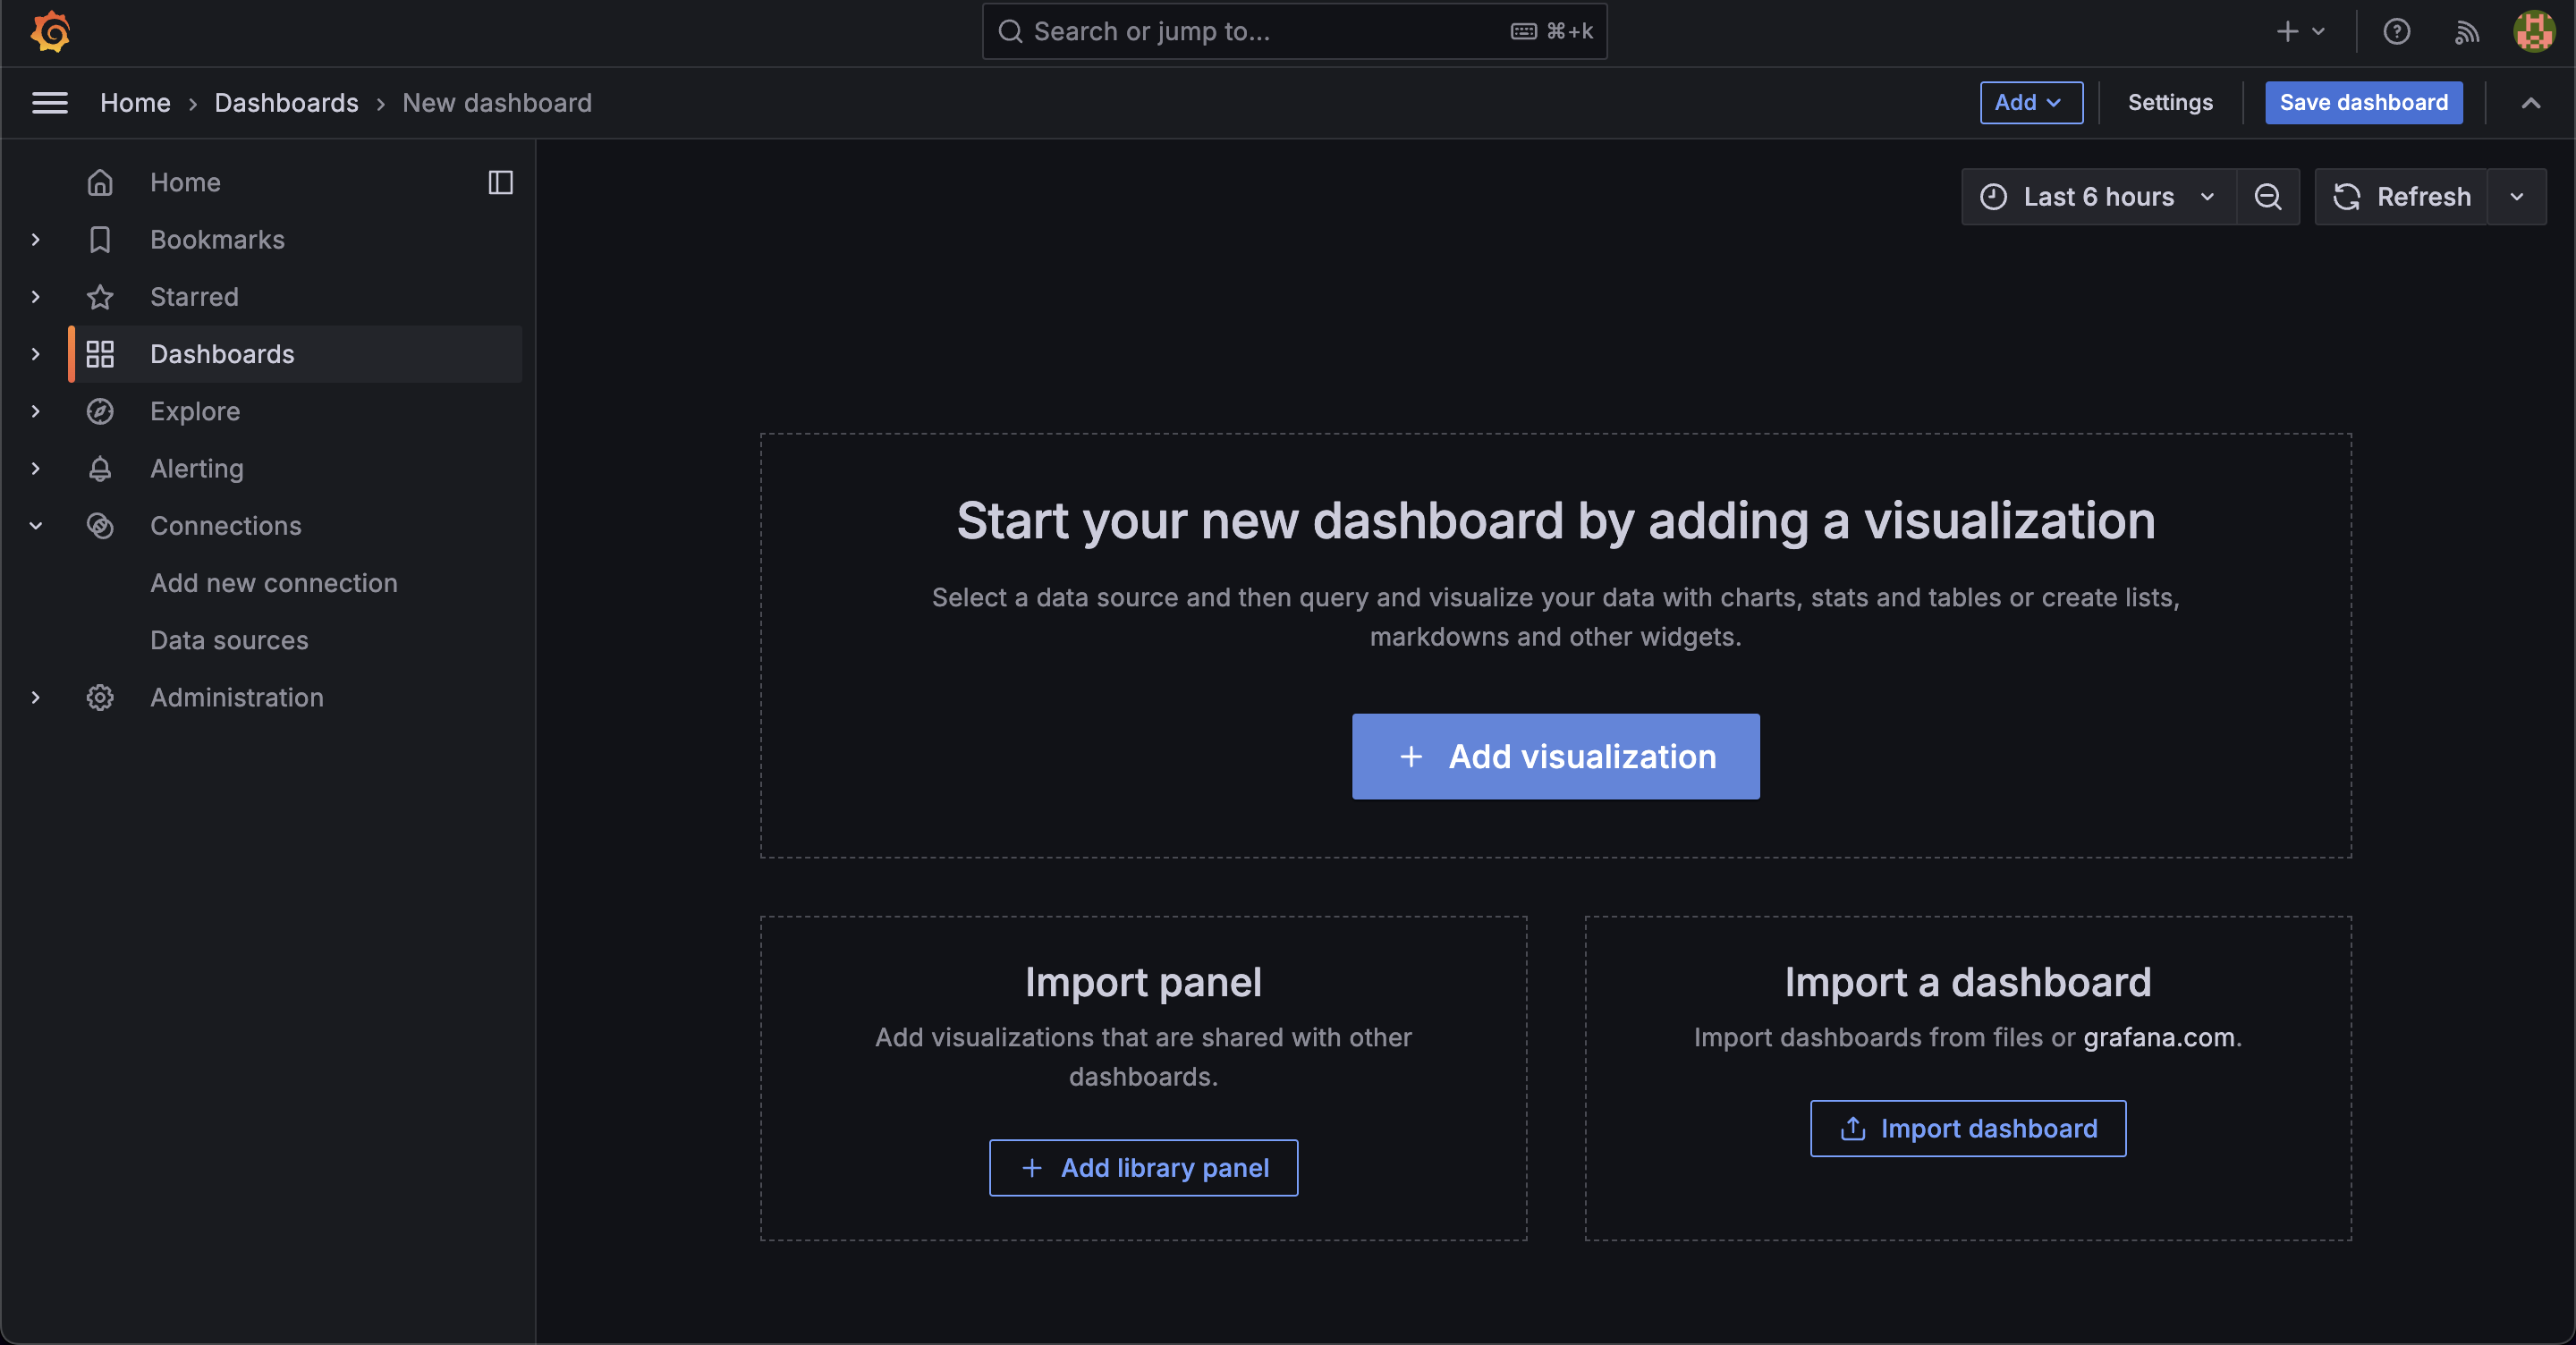
1. Set Up a New Dashboard
- Click "Building a Dashboard" from the success message.
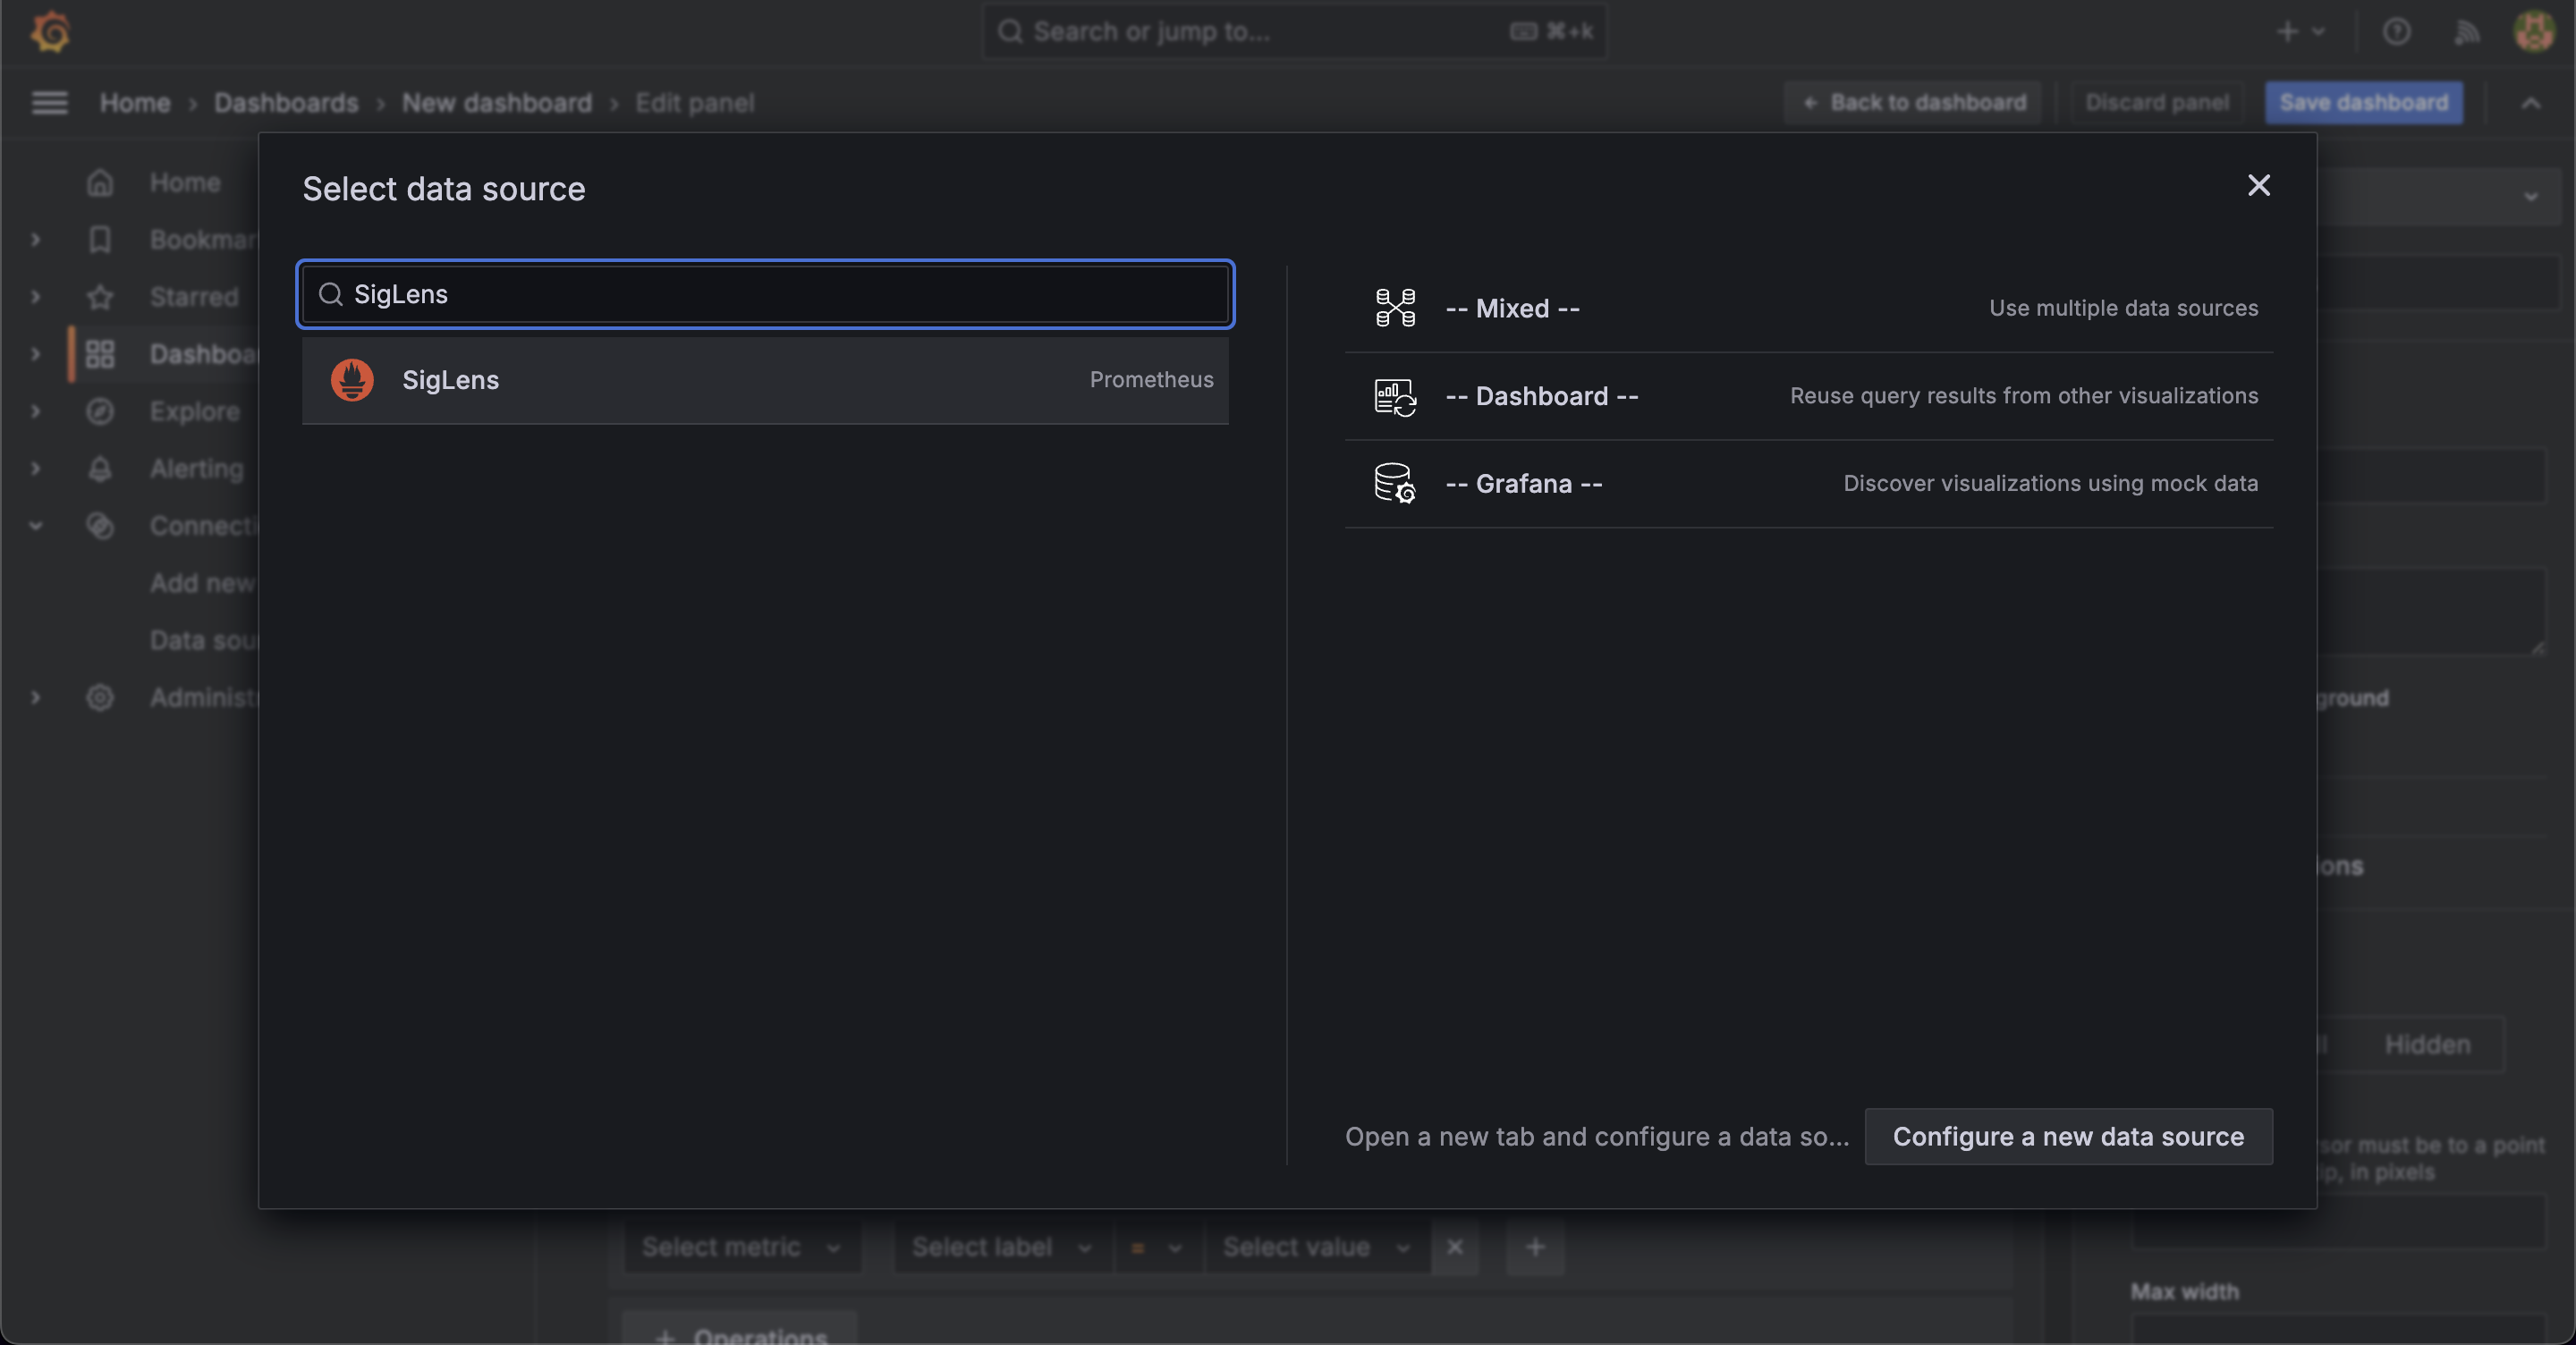
- Click "Add visualization" in the empty dashboard
- Choose your newly configured SigLens data source
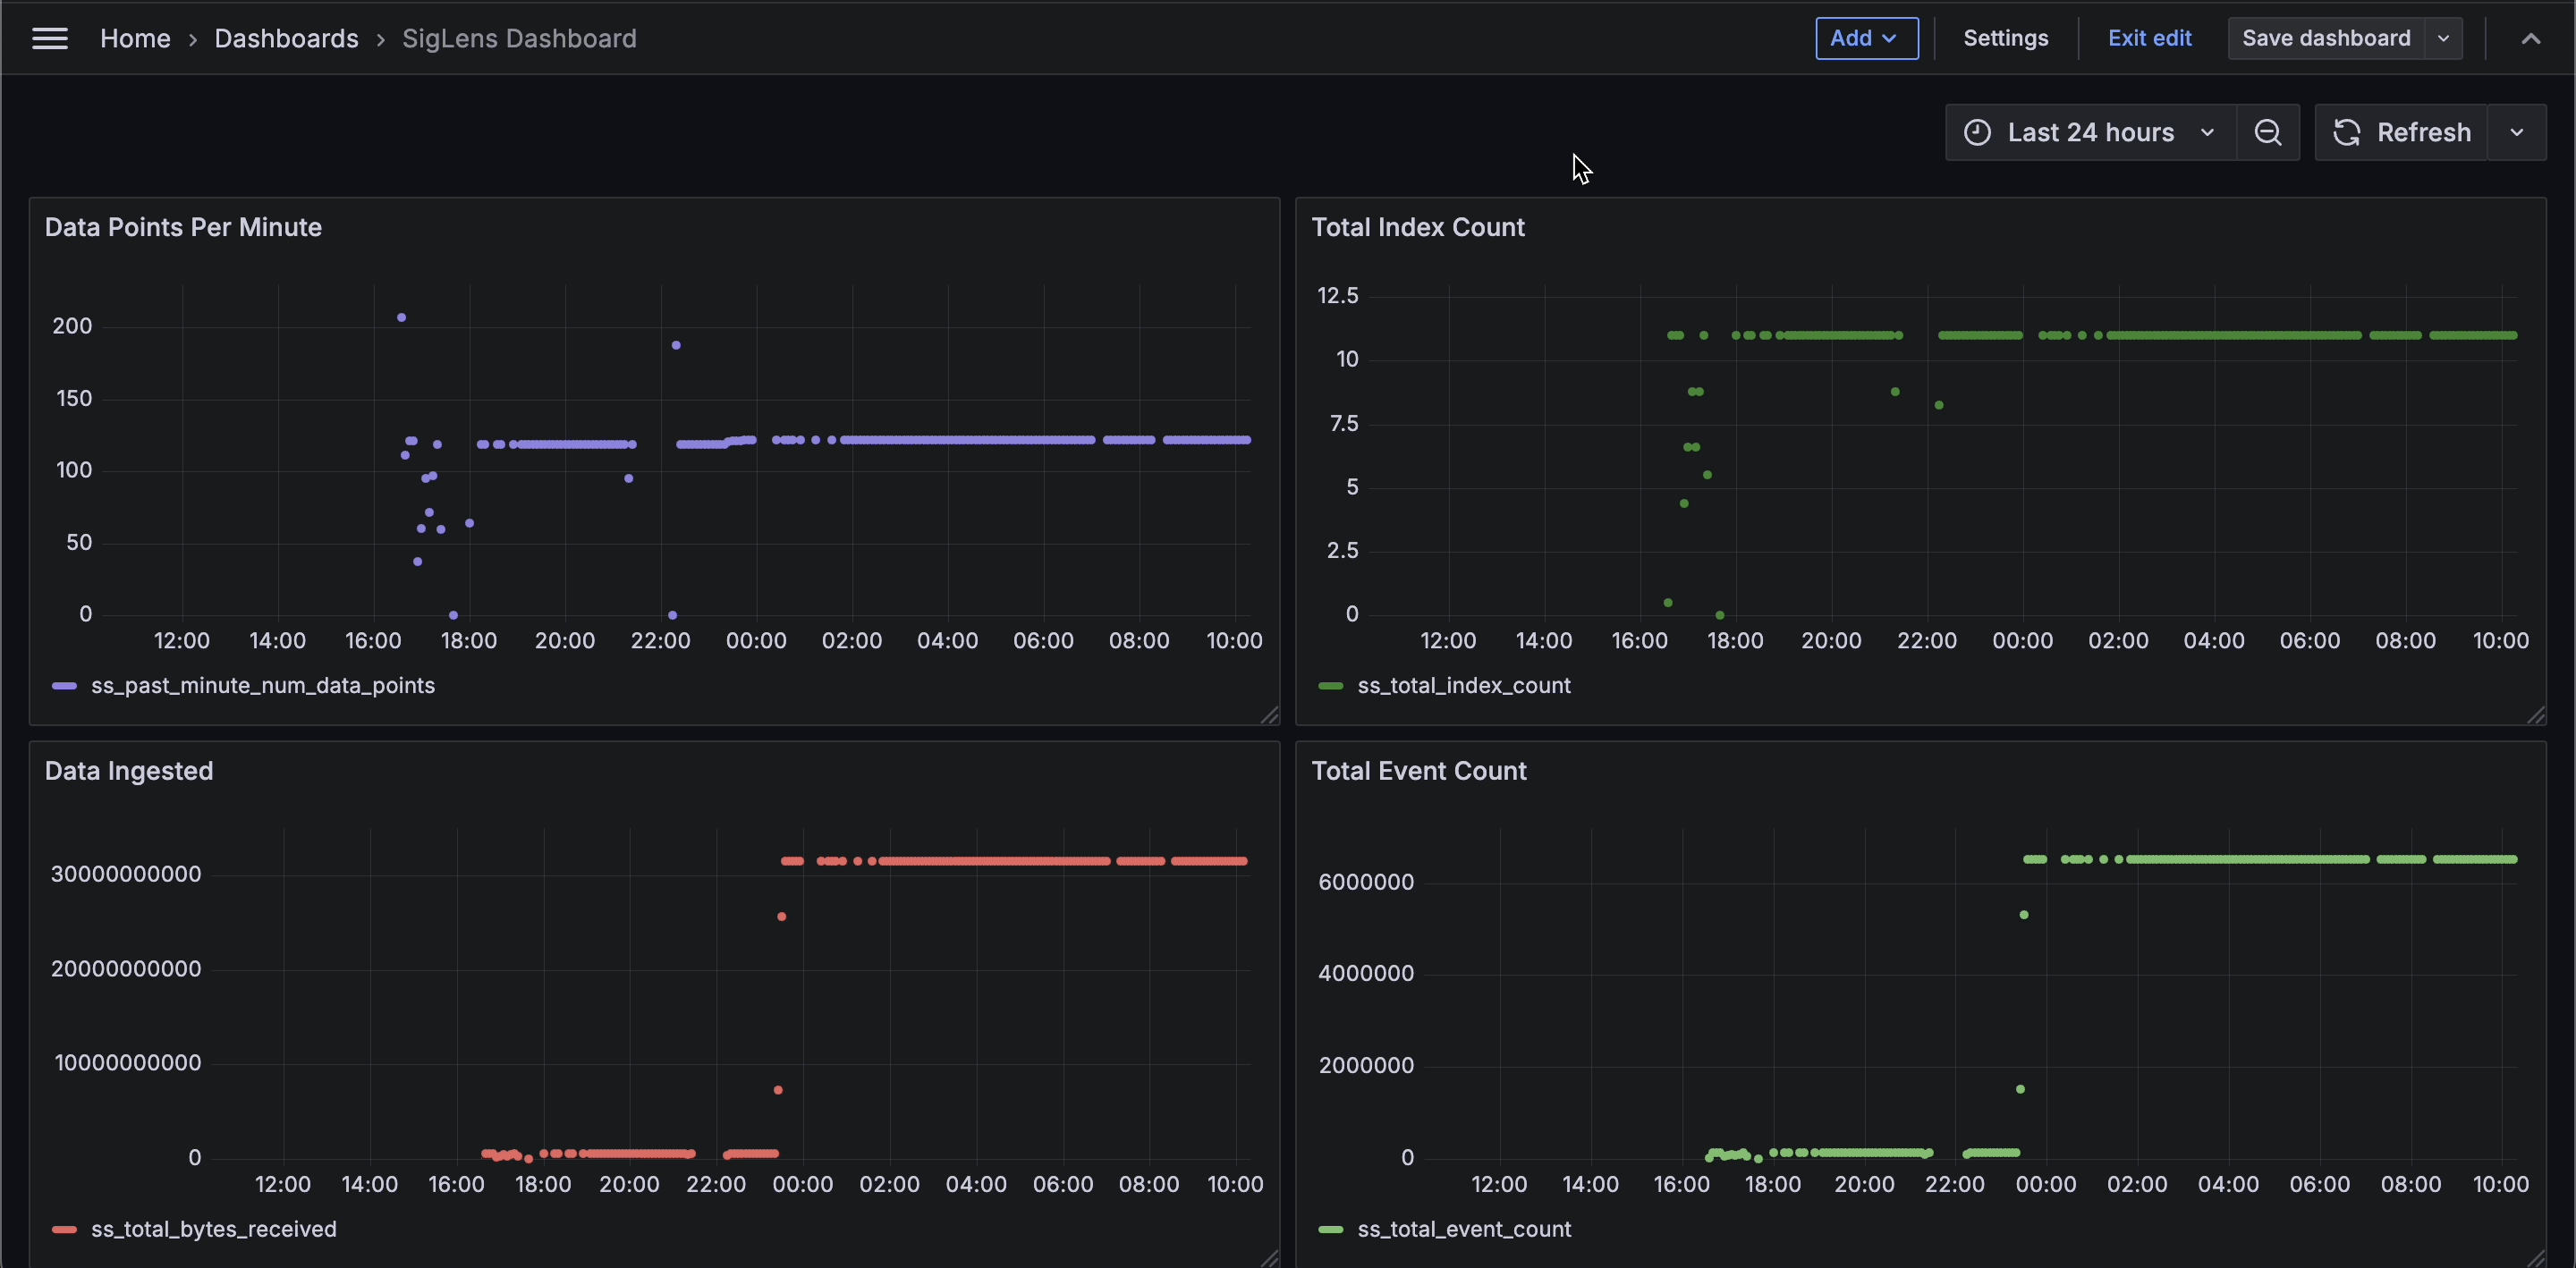
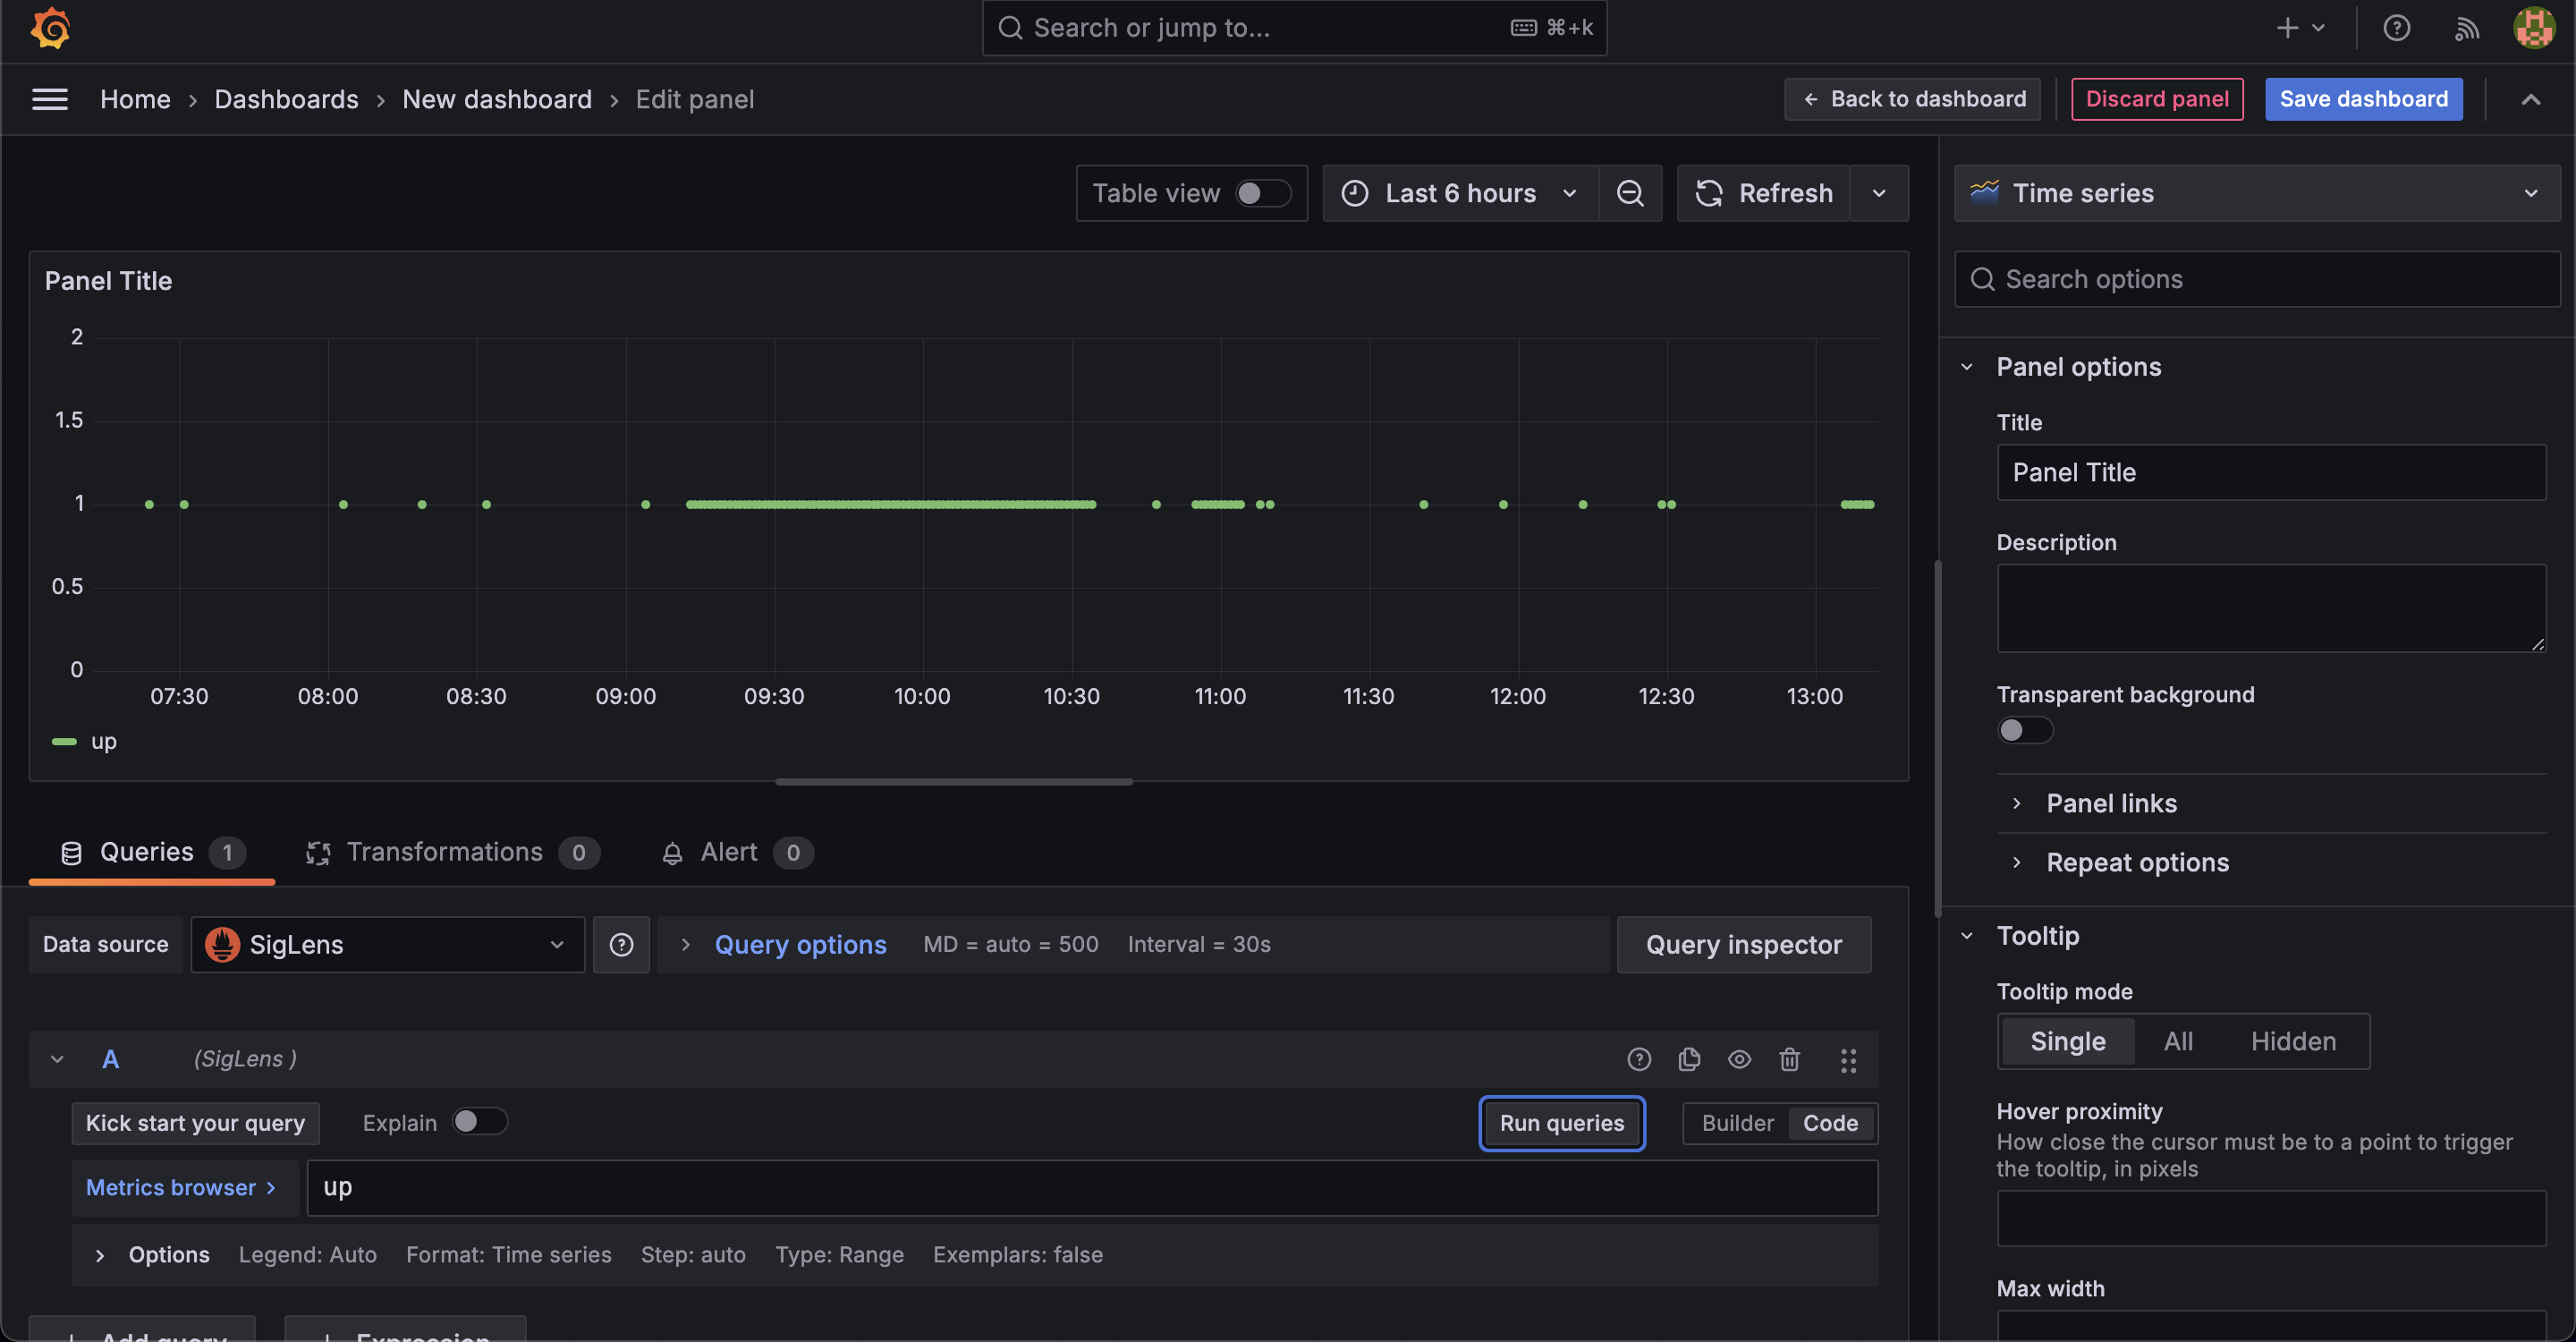
2. Configure Your First Panel
- In the Query editor, enter a test PromQL query
up - Click "Run queries" to test
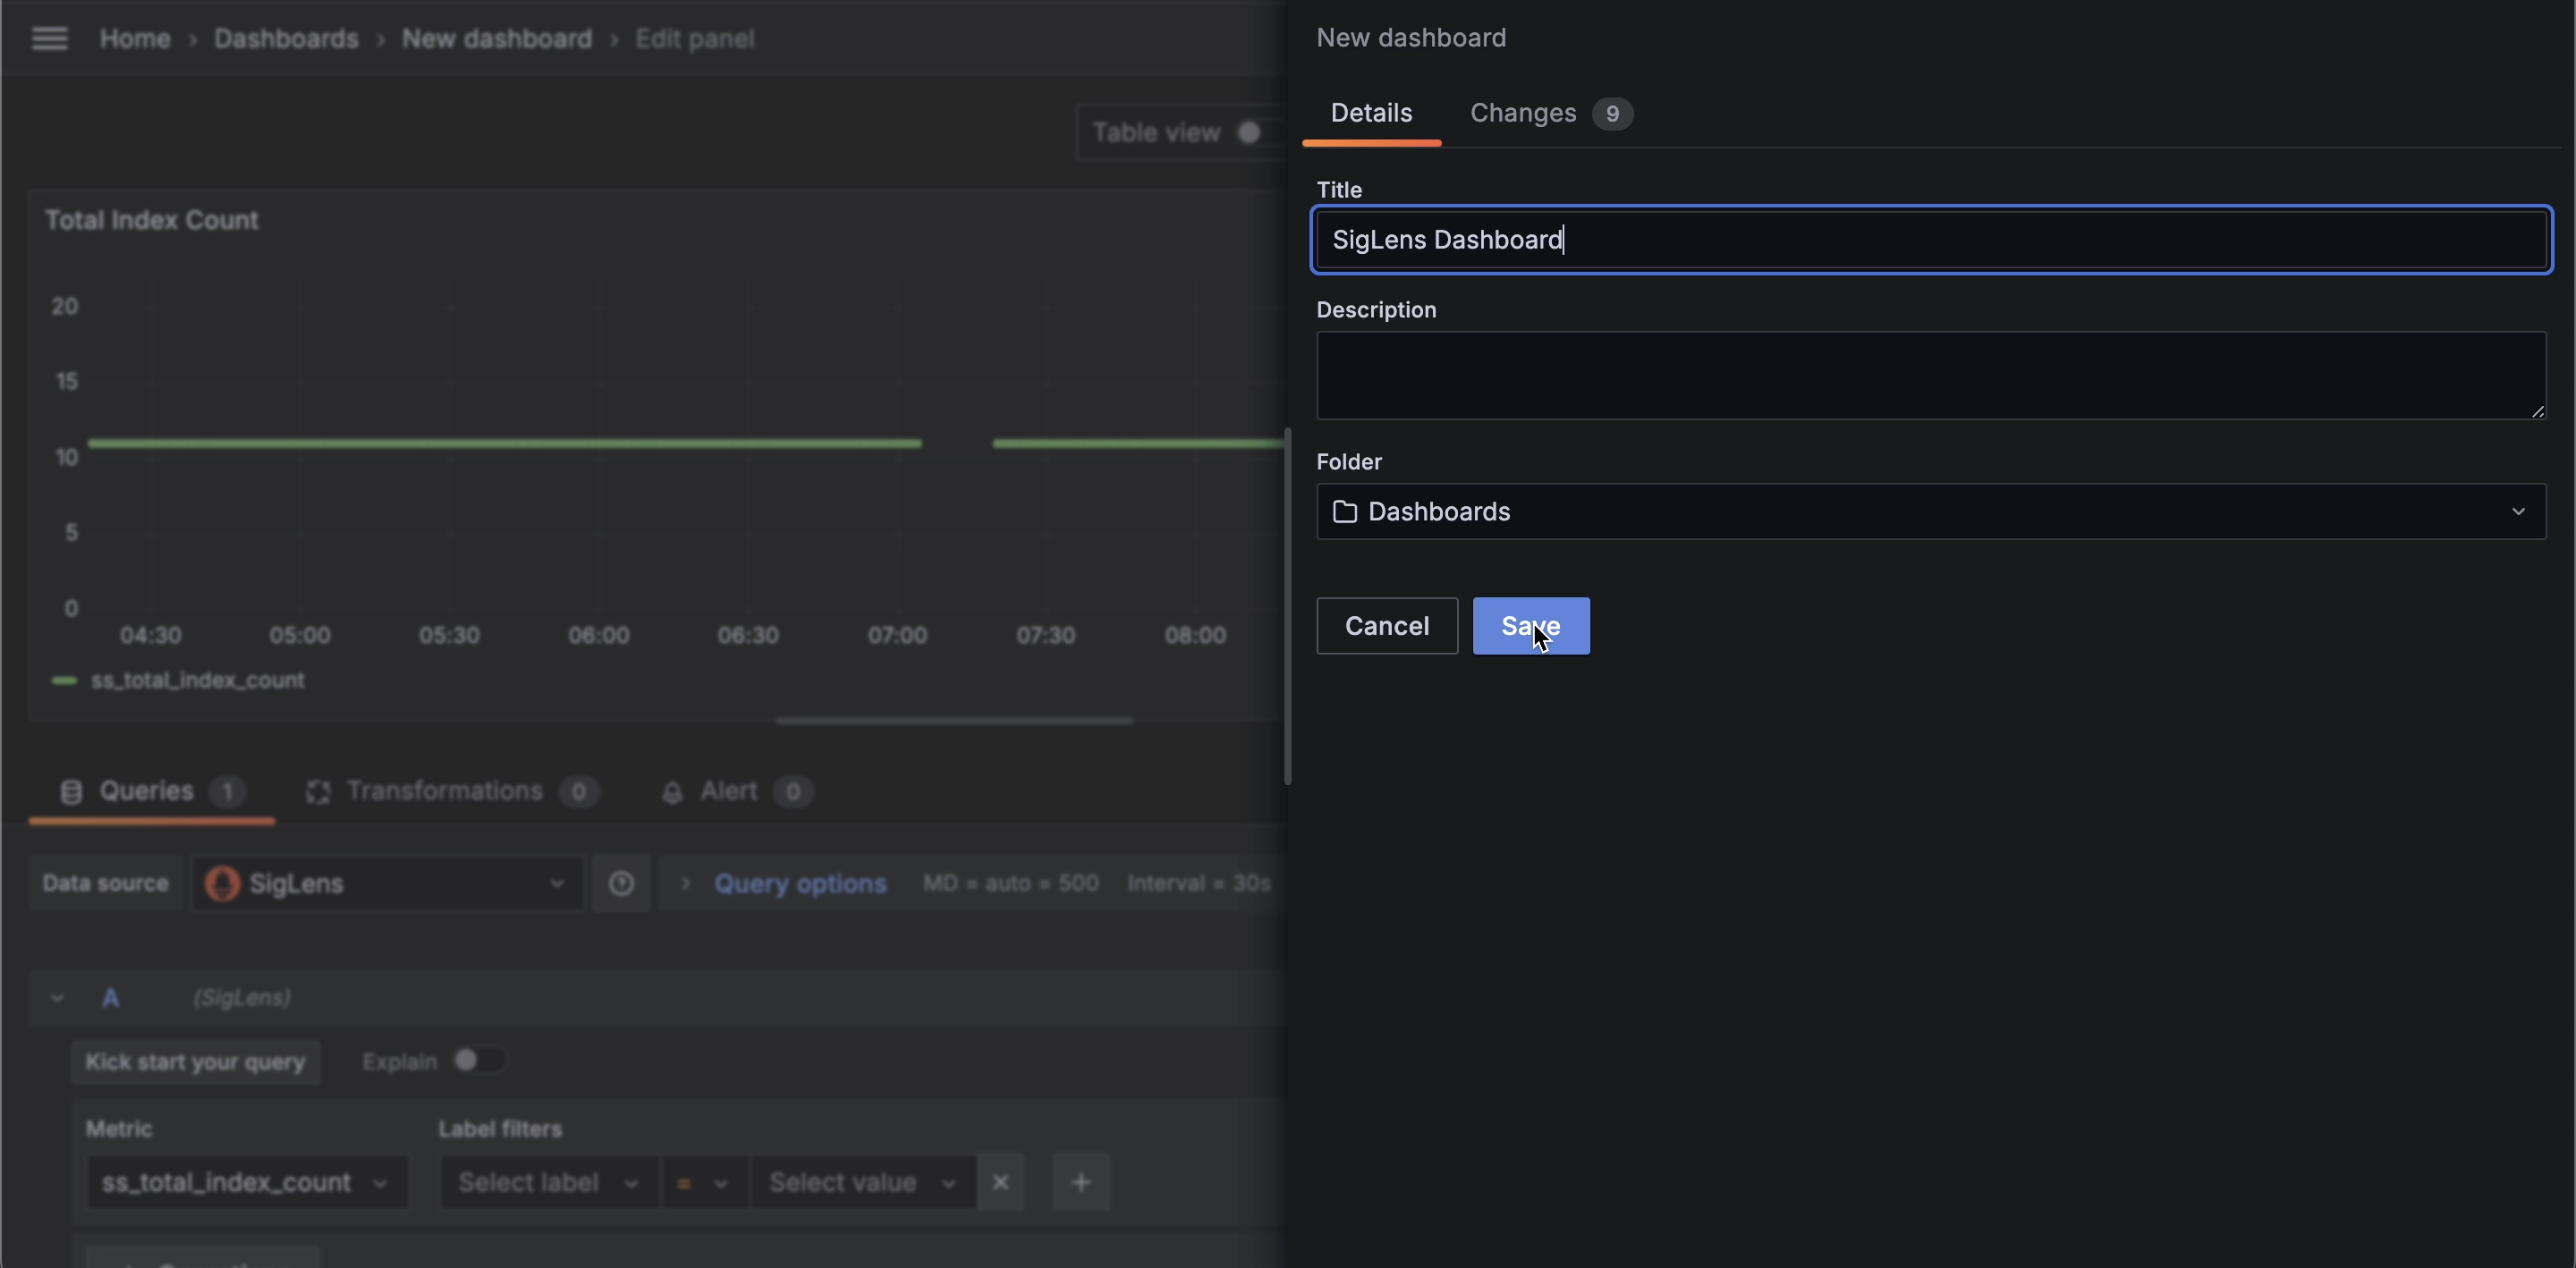
3. Save Your Dashboard
- Save your dashboard by clicking the save icon in the top right
- Add a meaningful dashboard title
- Create additional panels as needed for your metrics