Dashboards
📈 Create Panel Demo :
⭐ Create Panel for Spunk QL Query ⭐
-
Add and Edit Panel:
-
Click on the 'Add Panel' option and then click on Edit.
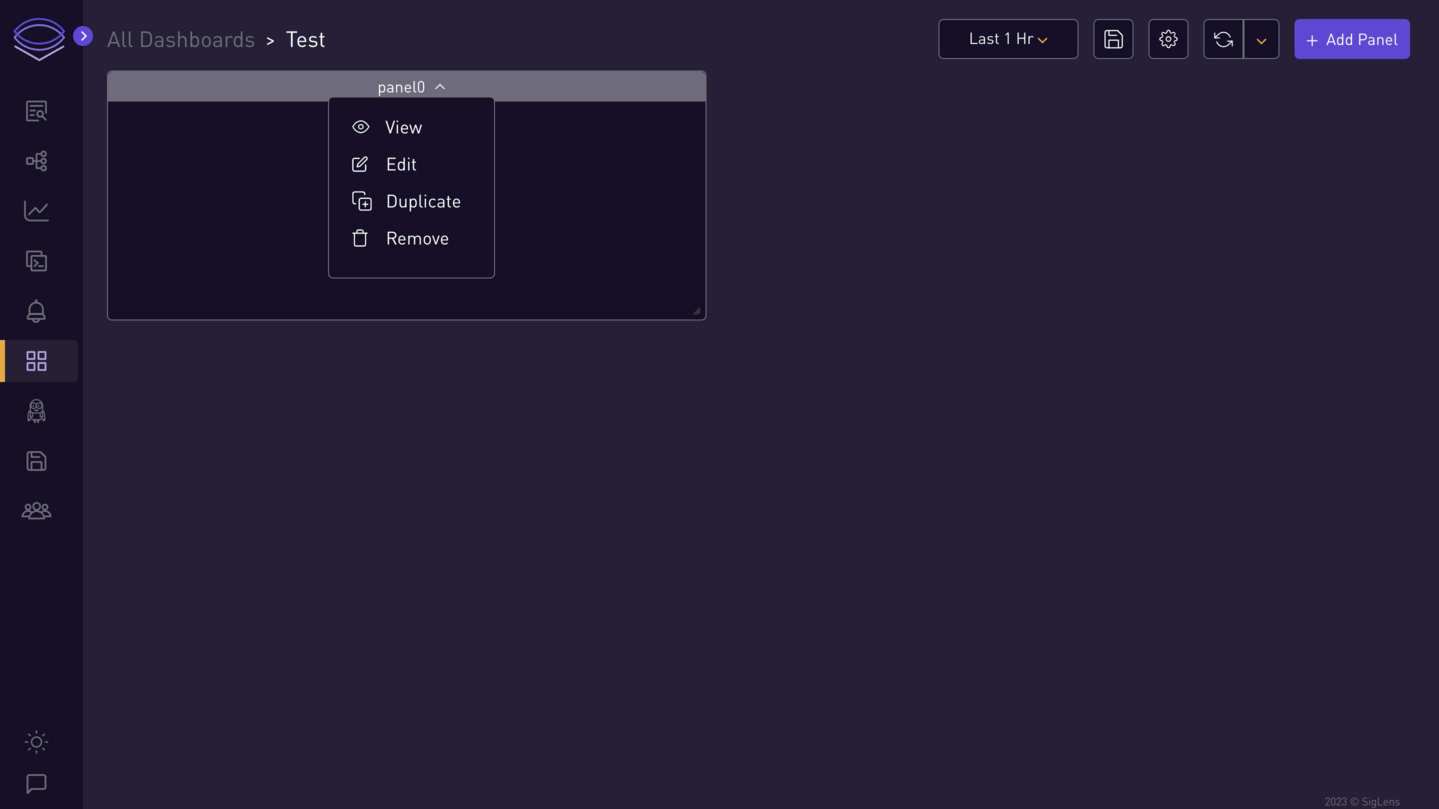
-
-
Select Data Source:
-
Example: Logs
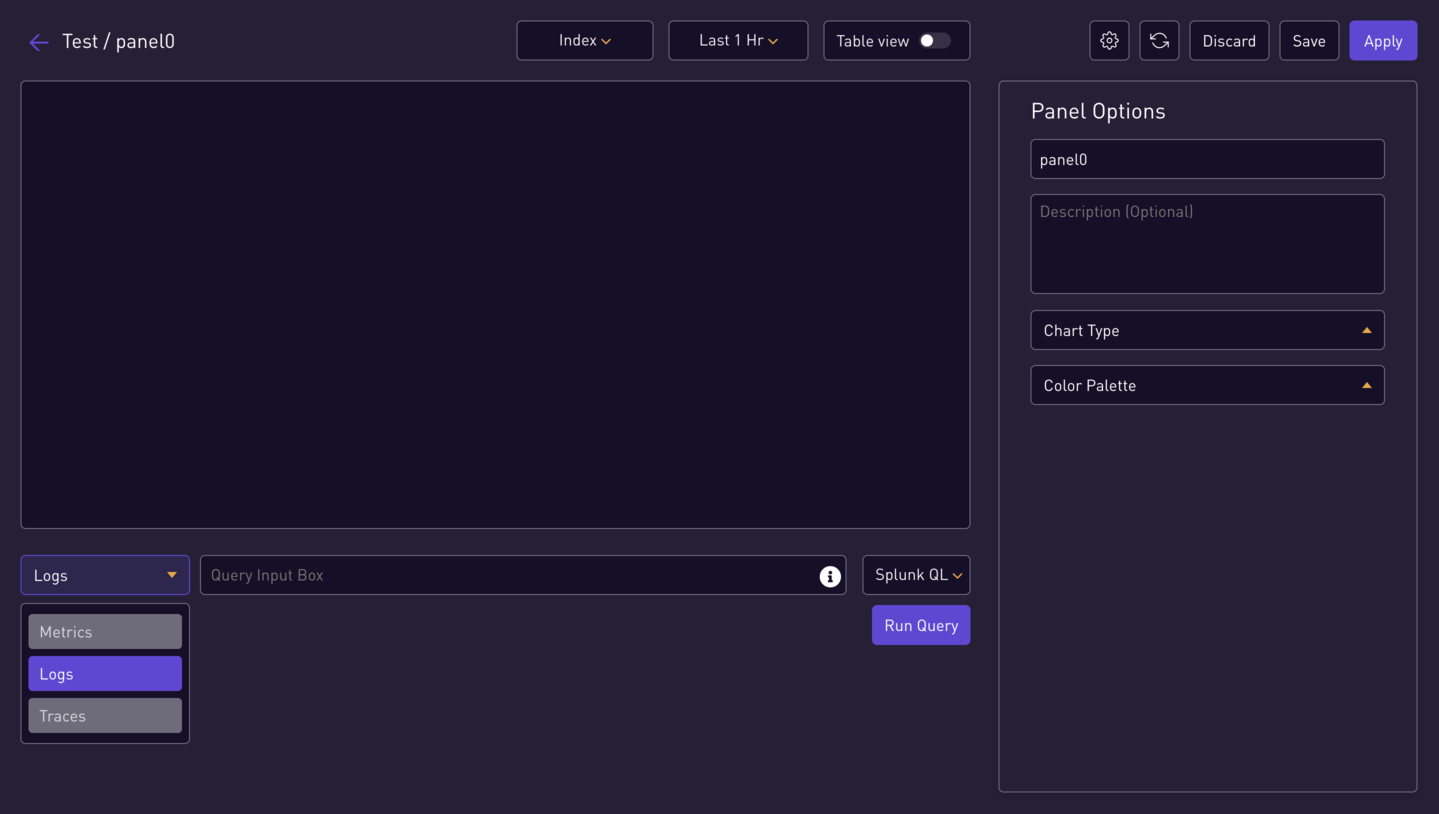
-
-
Choose Query Language:
-
Example: Splunk QL
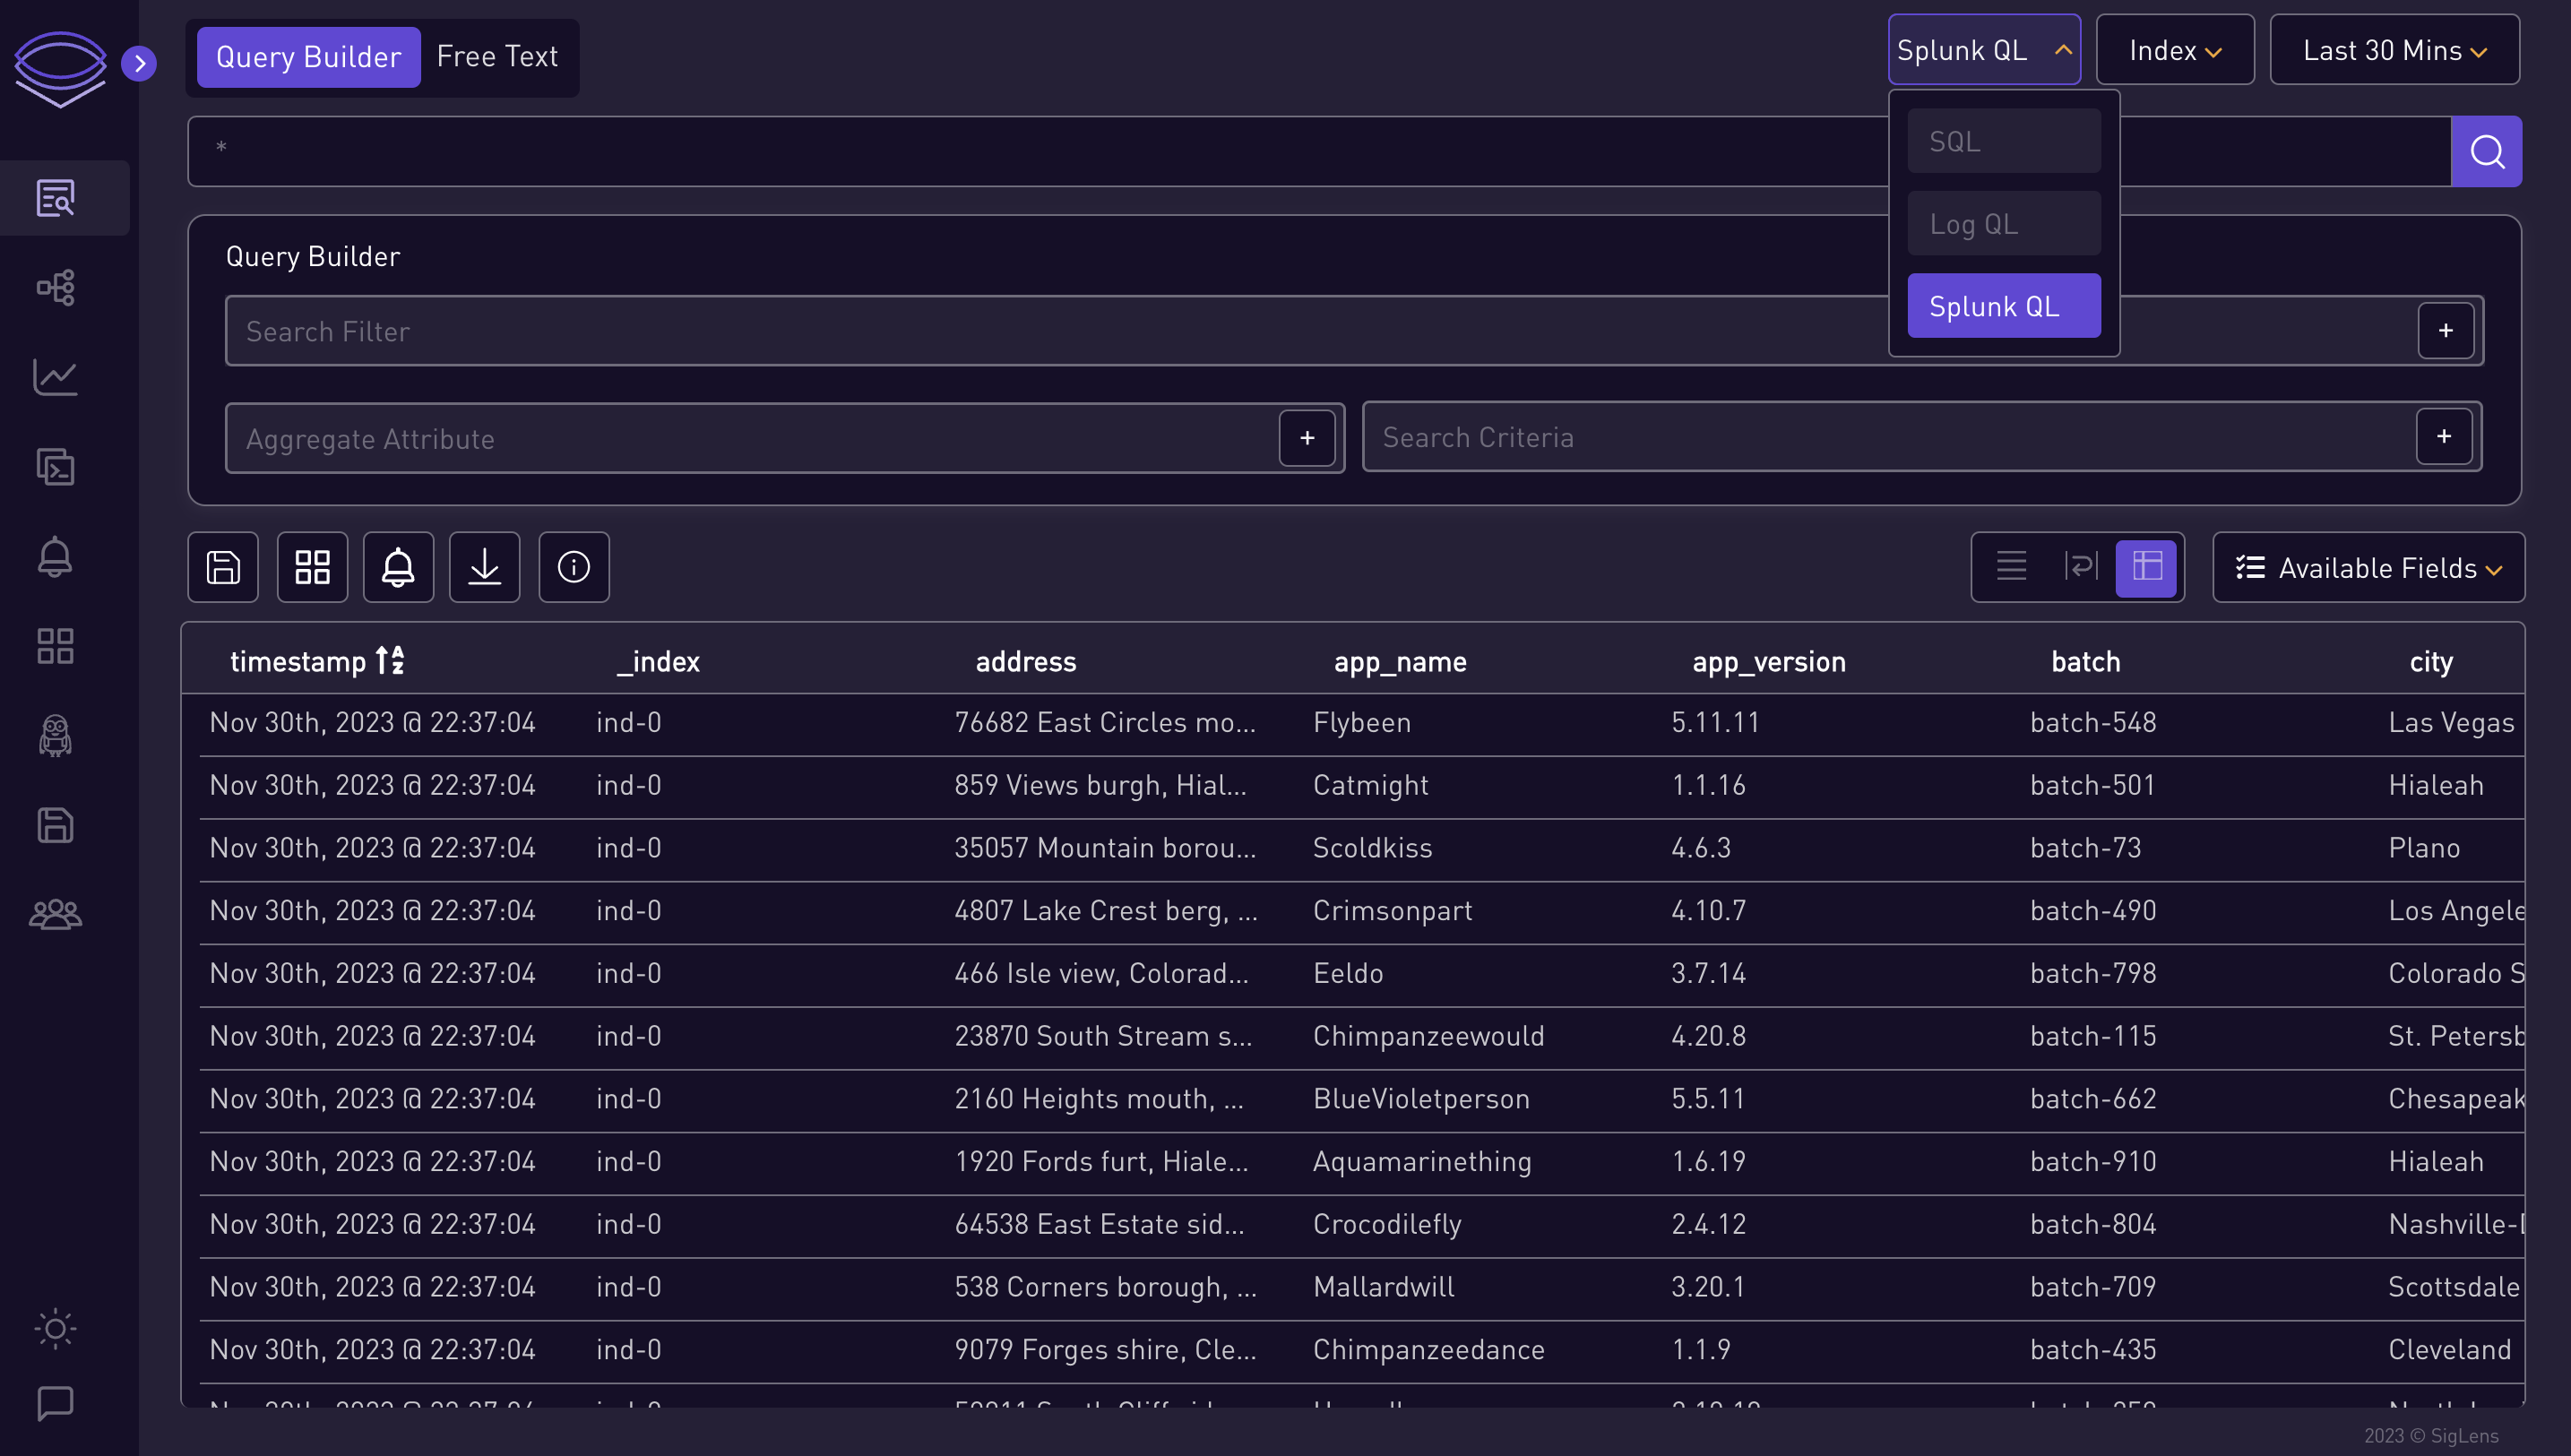
-
-
Enter Spunk QL Query:
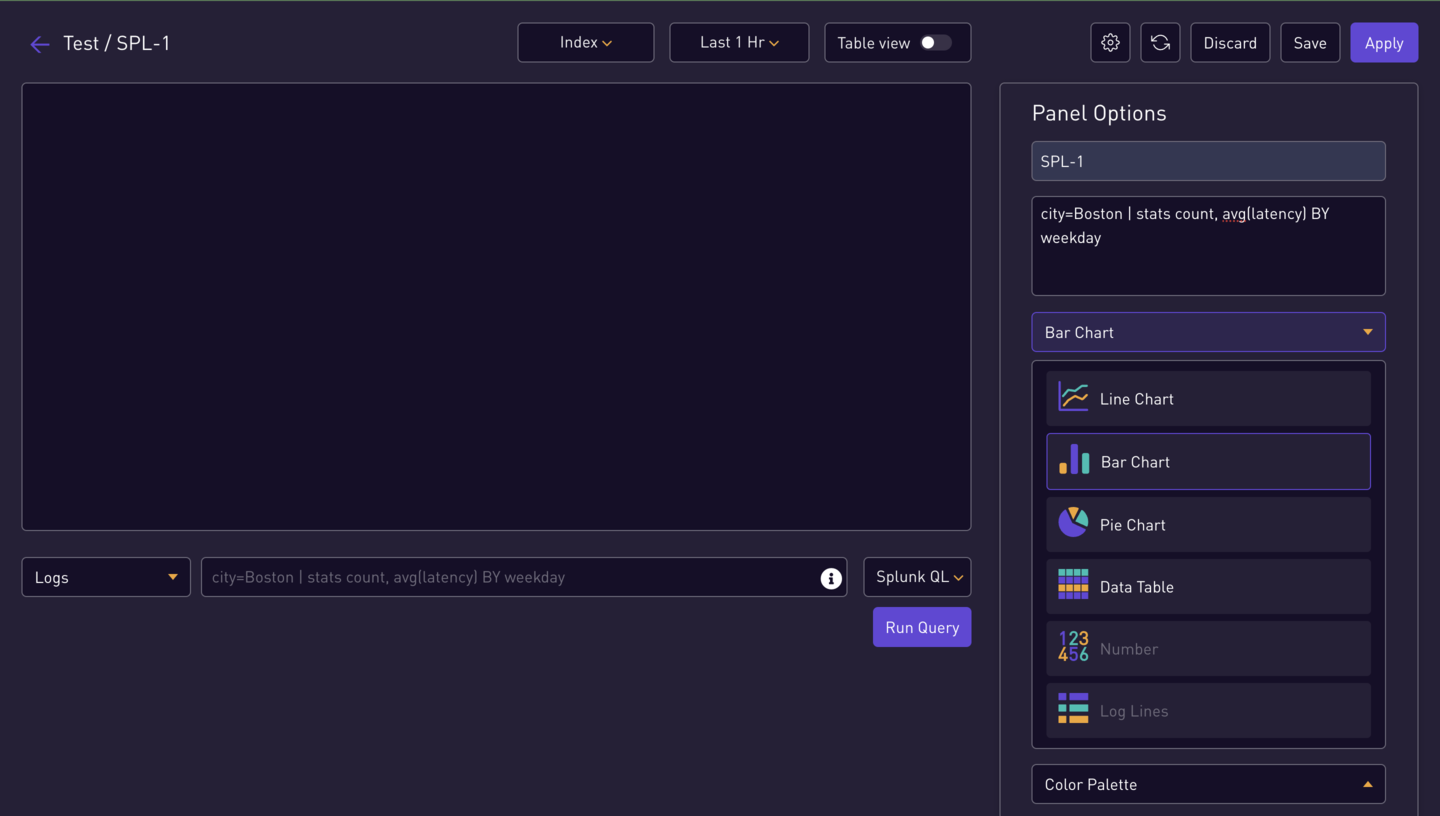
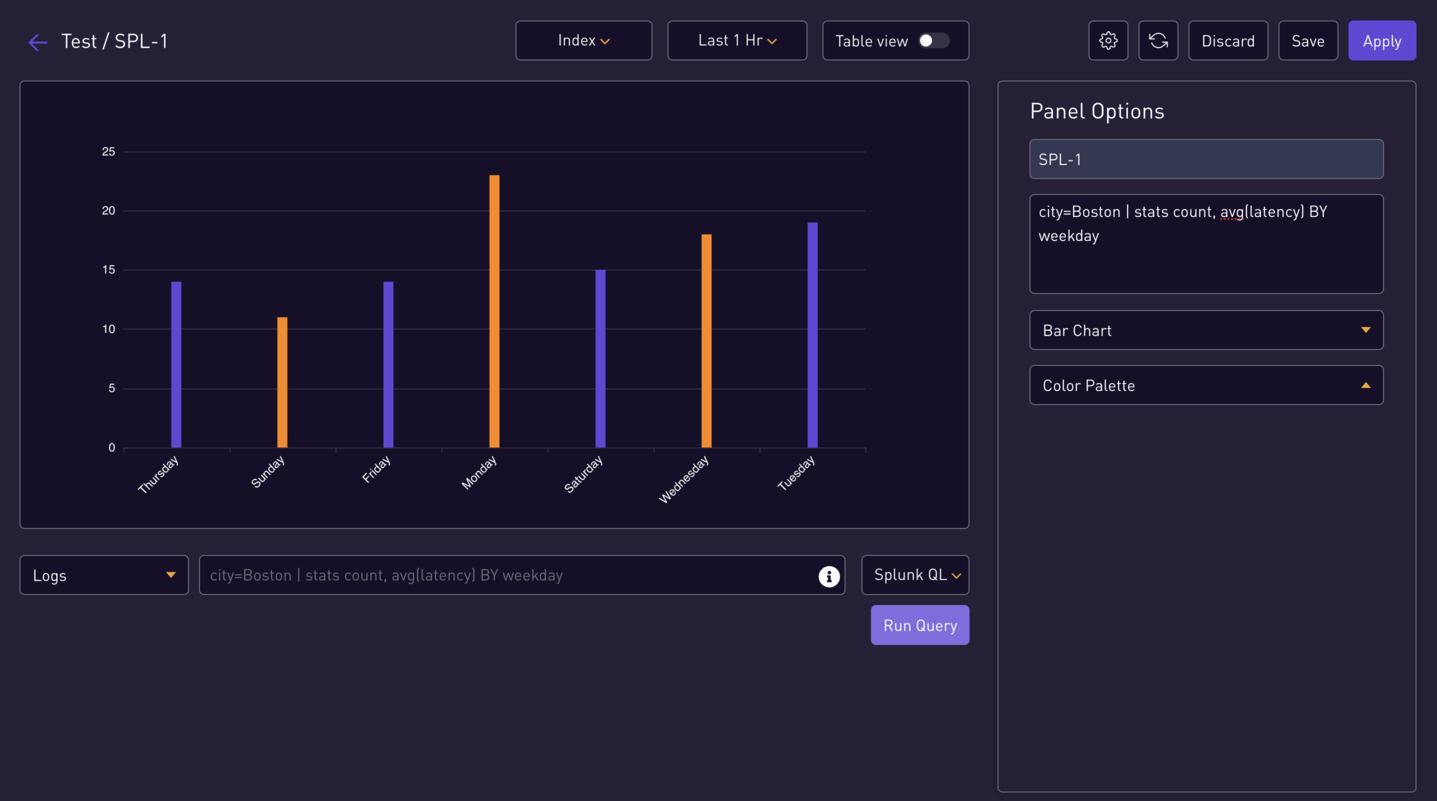
city=Boston | stats count, avg(latency) BY weekday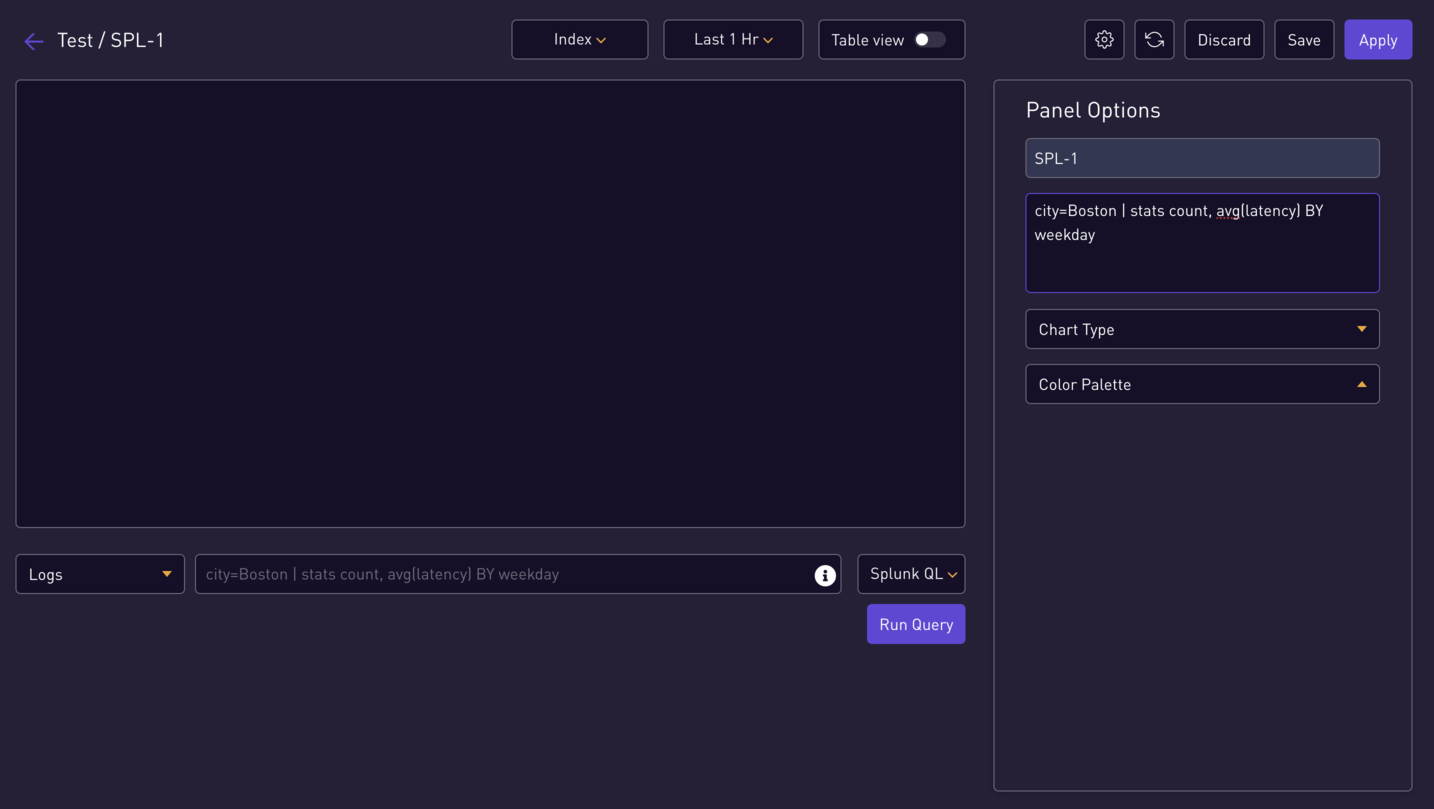
-
Fill in Splunk QL Panel Options:
-
Run Query:
-
Similarly you can add more Splunk QL Queries:
city=Boston | This is a comment fields http*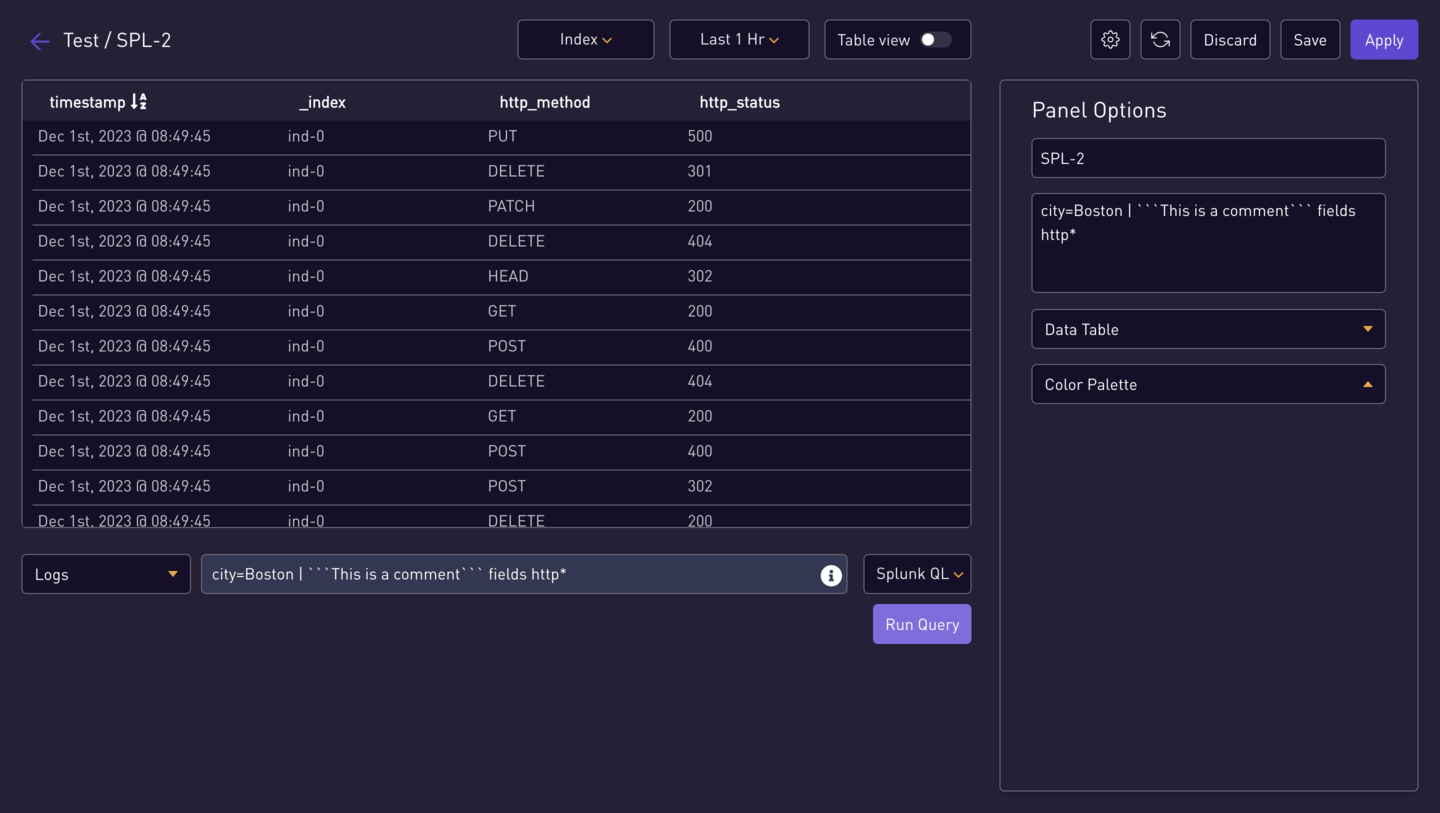
-
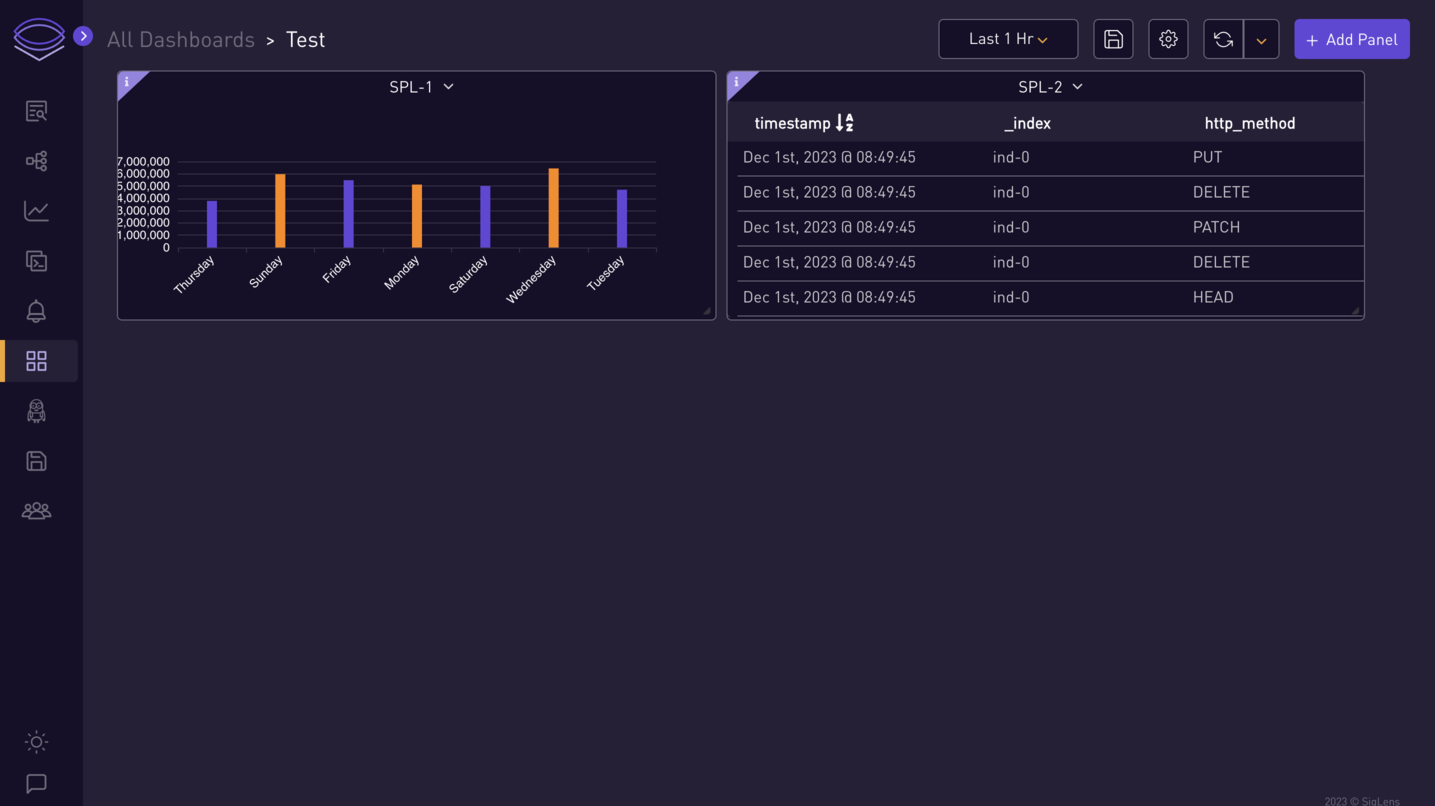
Panel View:
⭐ Create Panel for LogQL Query ⭐
Follow the same steps as for SPL and change the query language to LogQL. Modify the panel details as needed.
-
Enter LogQL Query:
{gender="female",city="Fresno"} != "batch-212"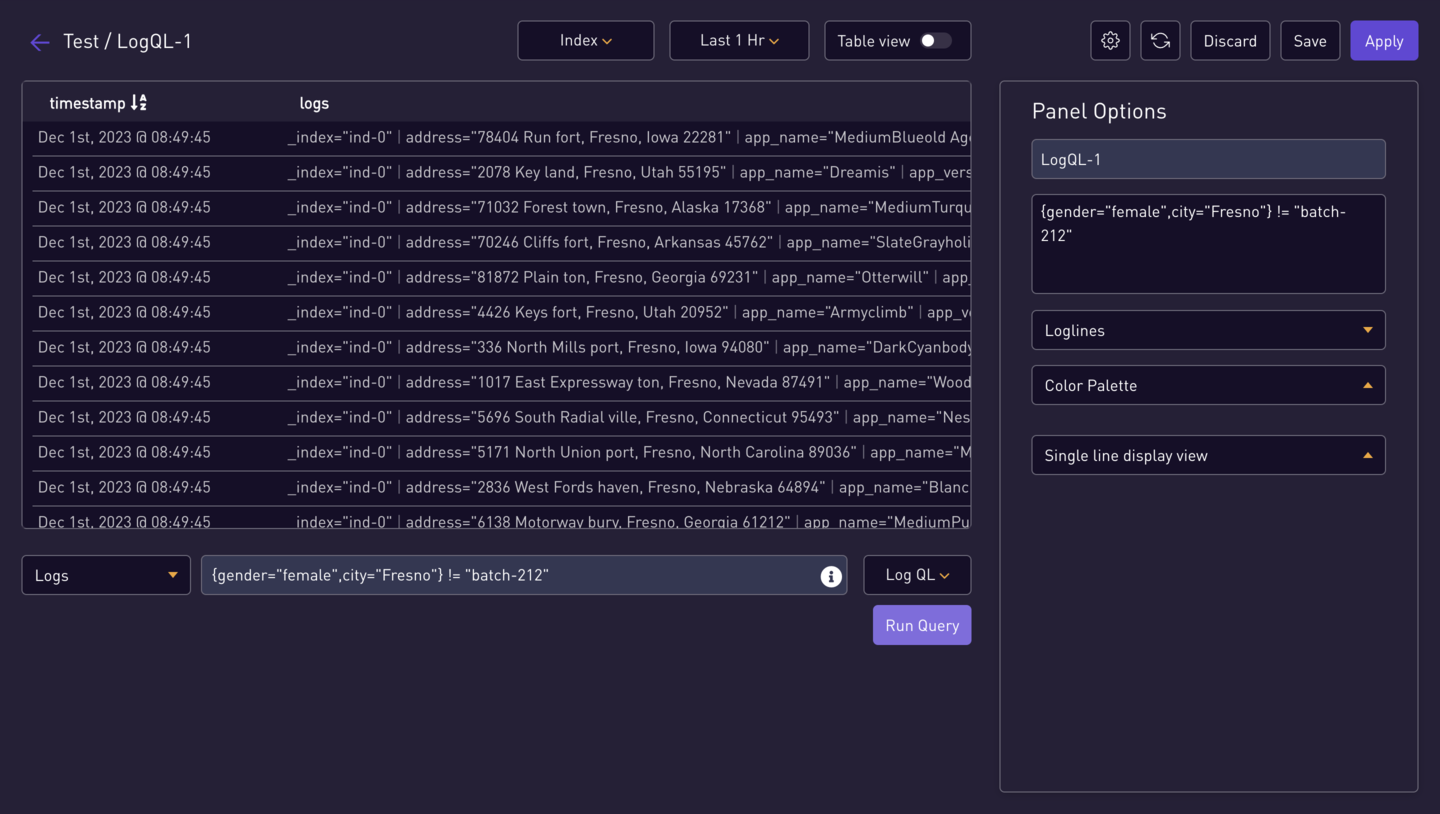
-
Additional LogQL Query:
{gender="female"} | json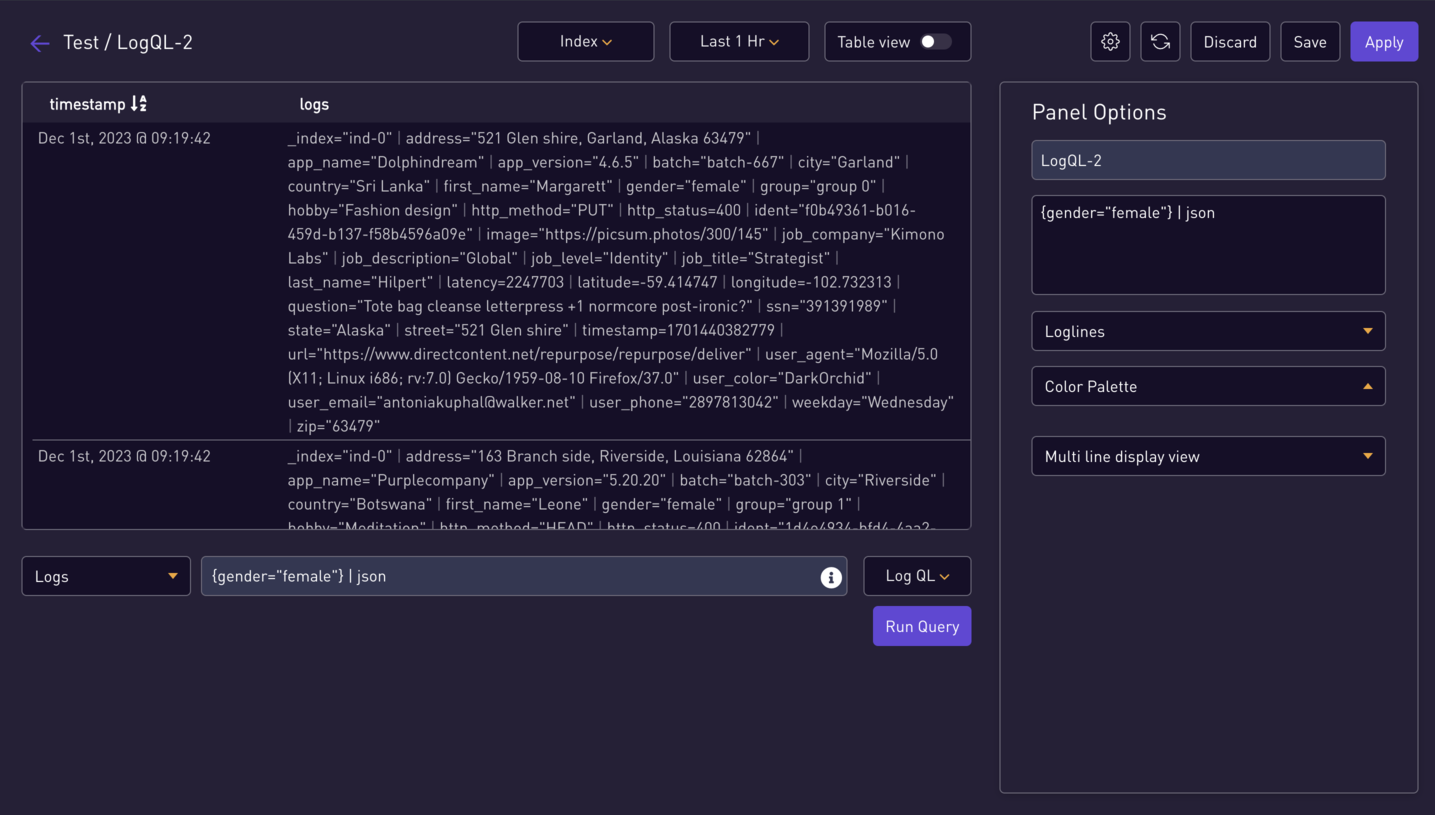
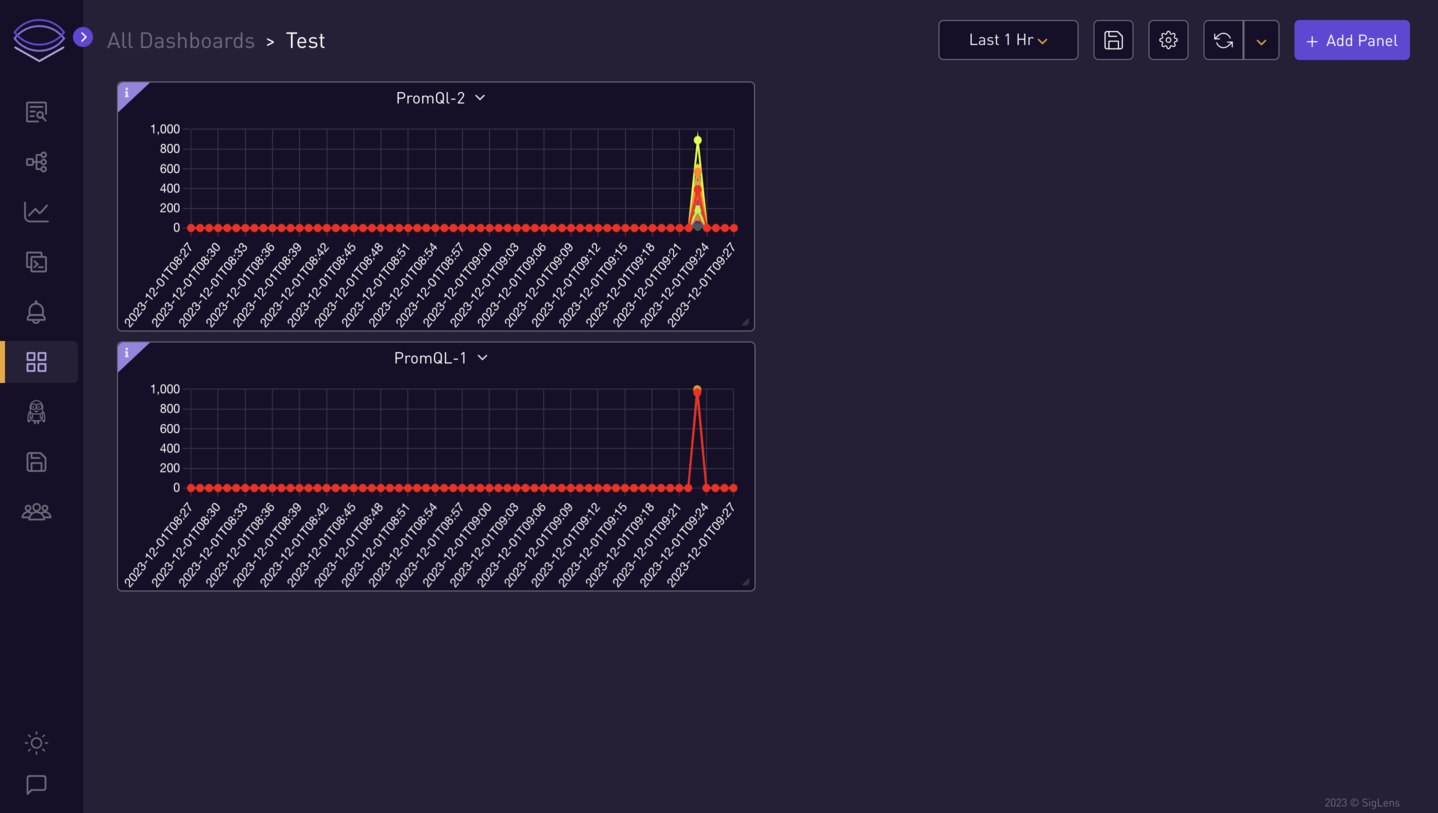
⭐ Create Panel for Metrics Query ⭐
Note: You need to ingest metrics data to get the metrics.
-
Enter Metrics Query:
max by (color) (testmetric0)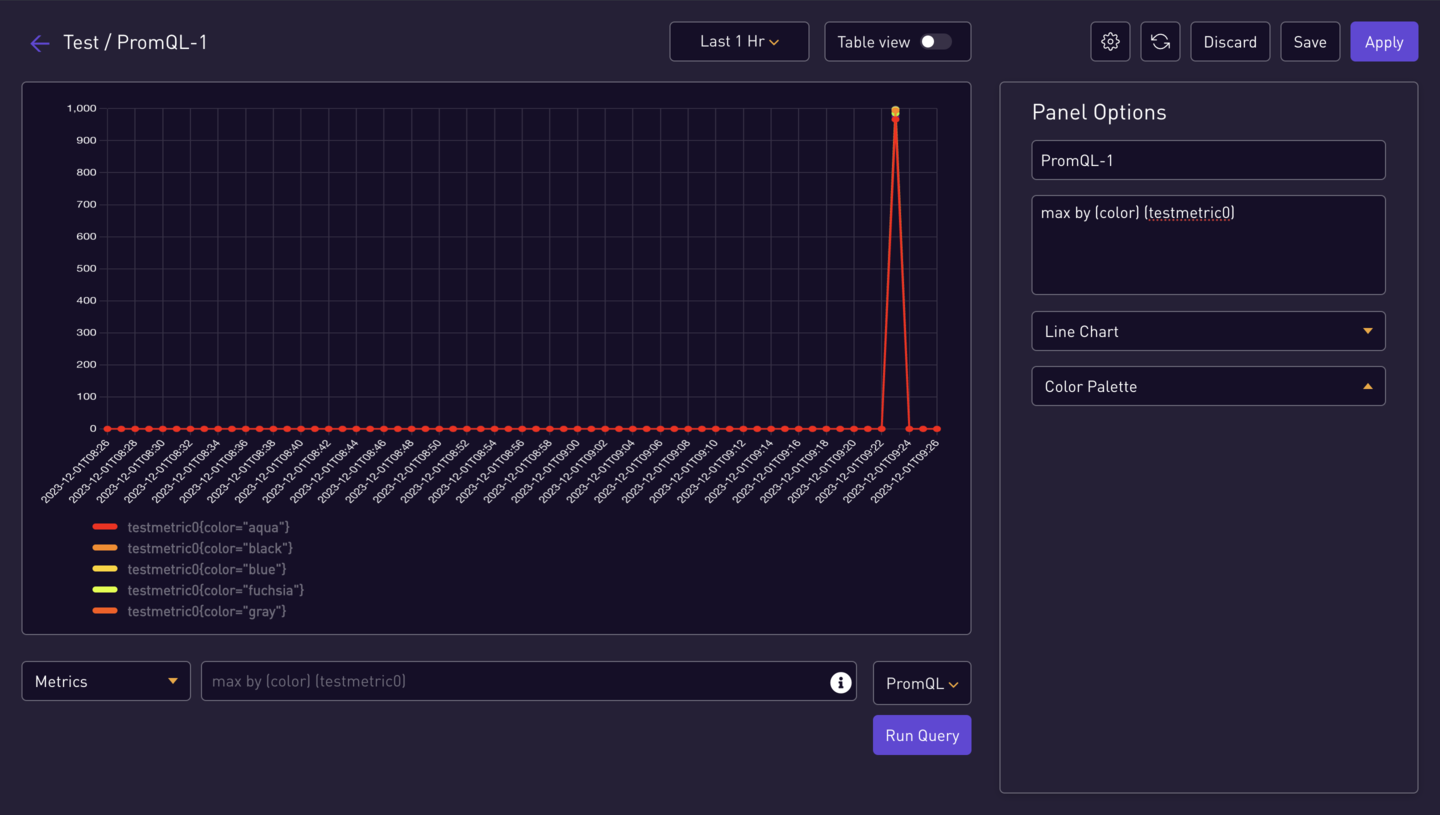
-
Additional Metrics Query:
min by (model) (testmetric0)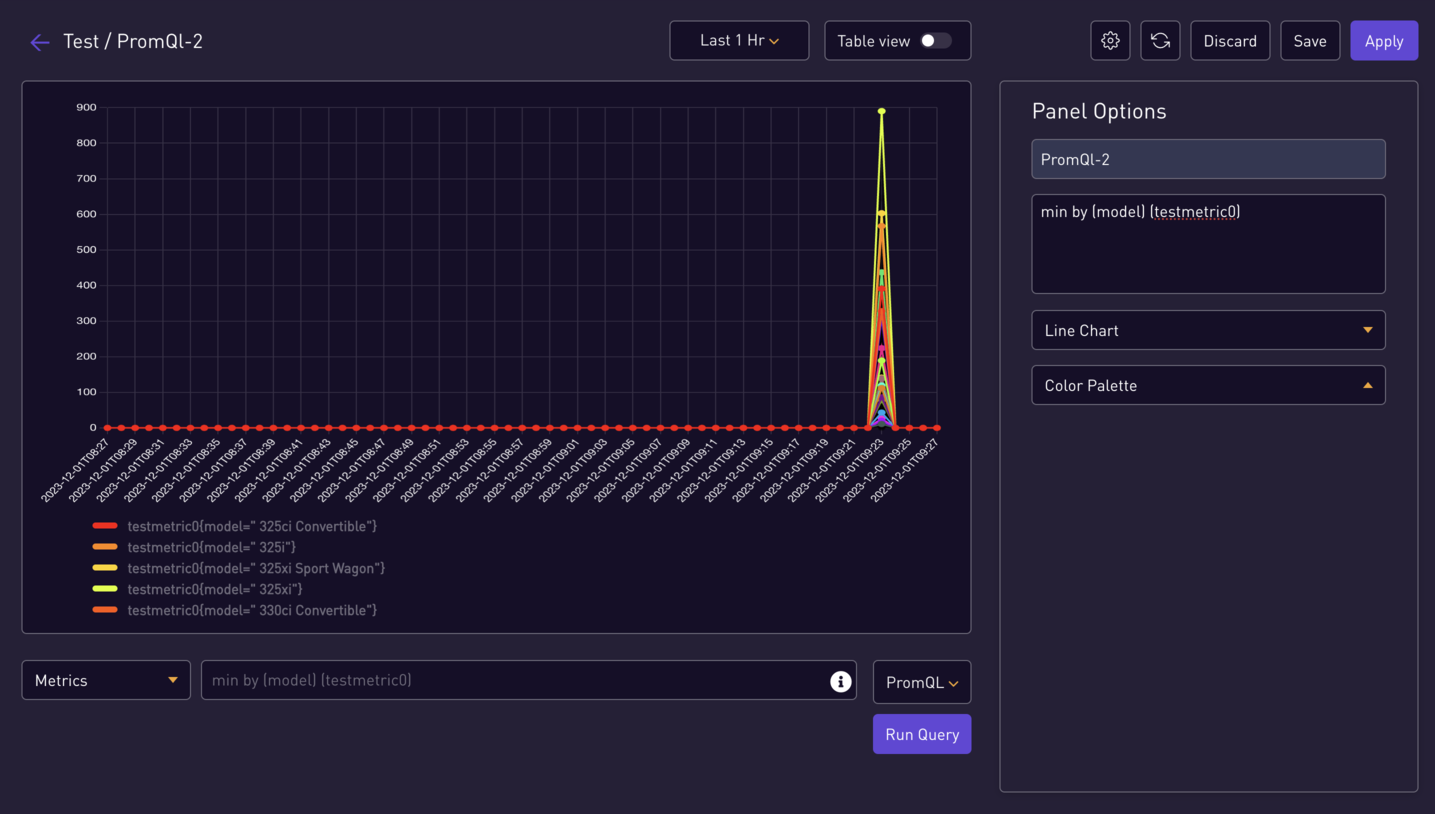
-
Panel Overview
⭐ Create Panel for Traces ⭐
Note: You need to ingest trace data to get the traces.
-
Enter Traces Query:
service="loadgenerator"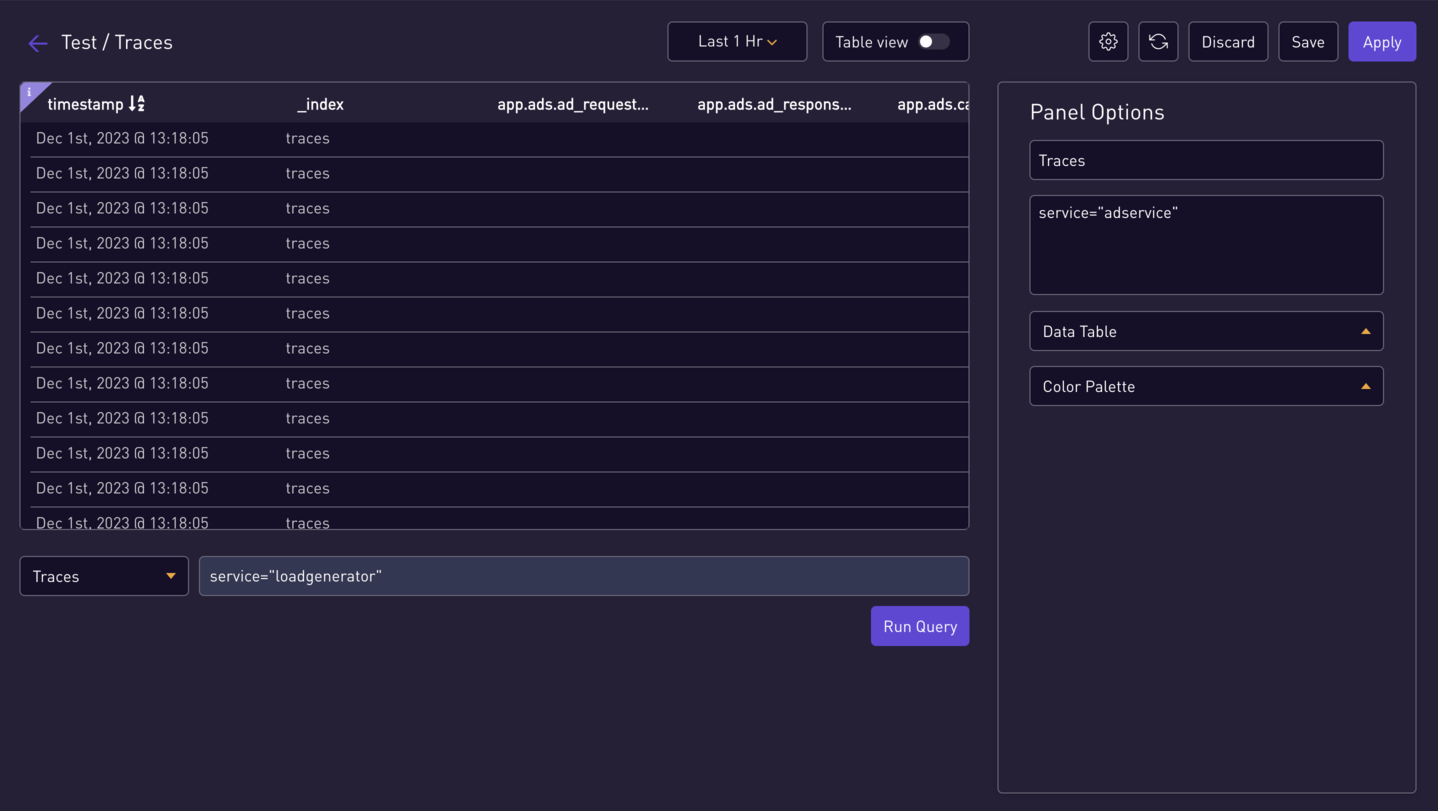
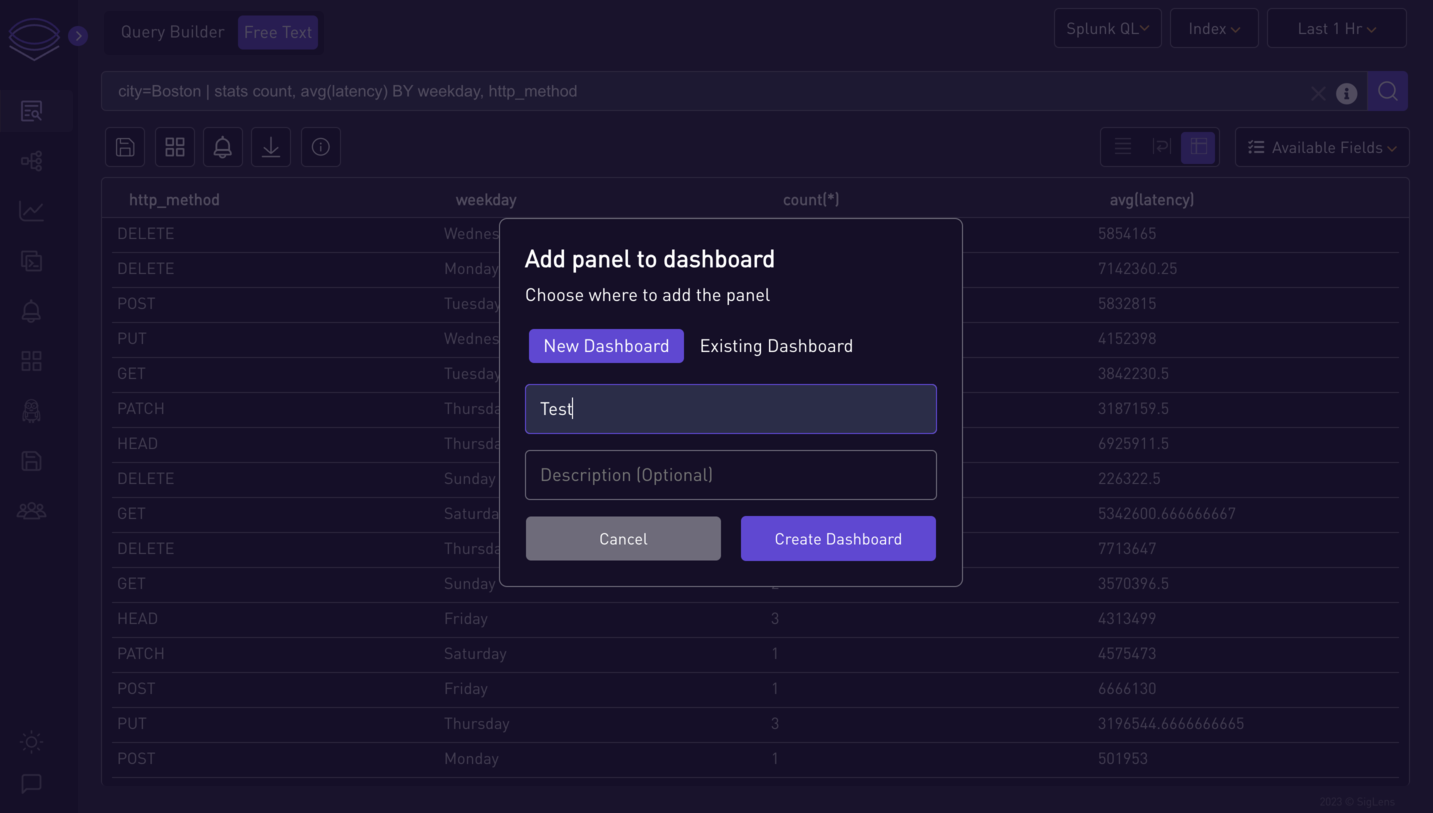
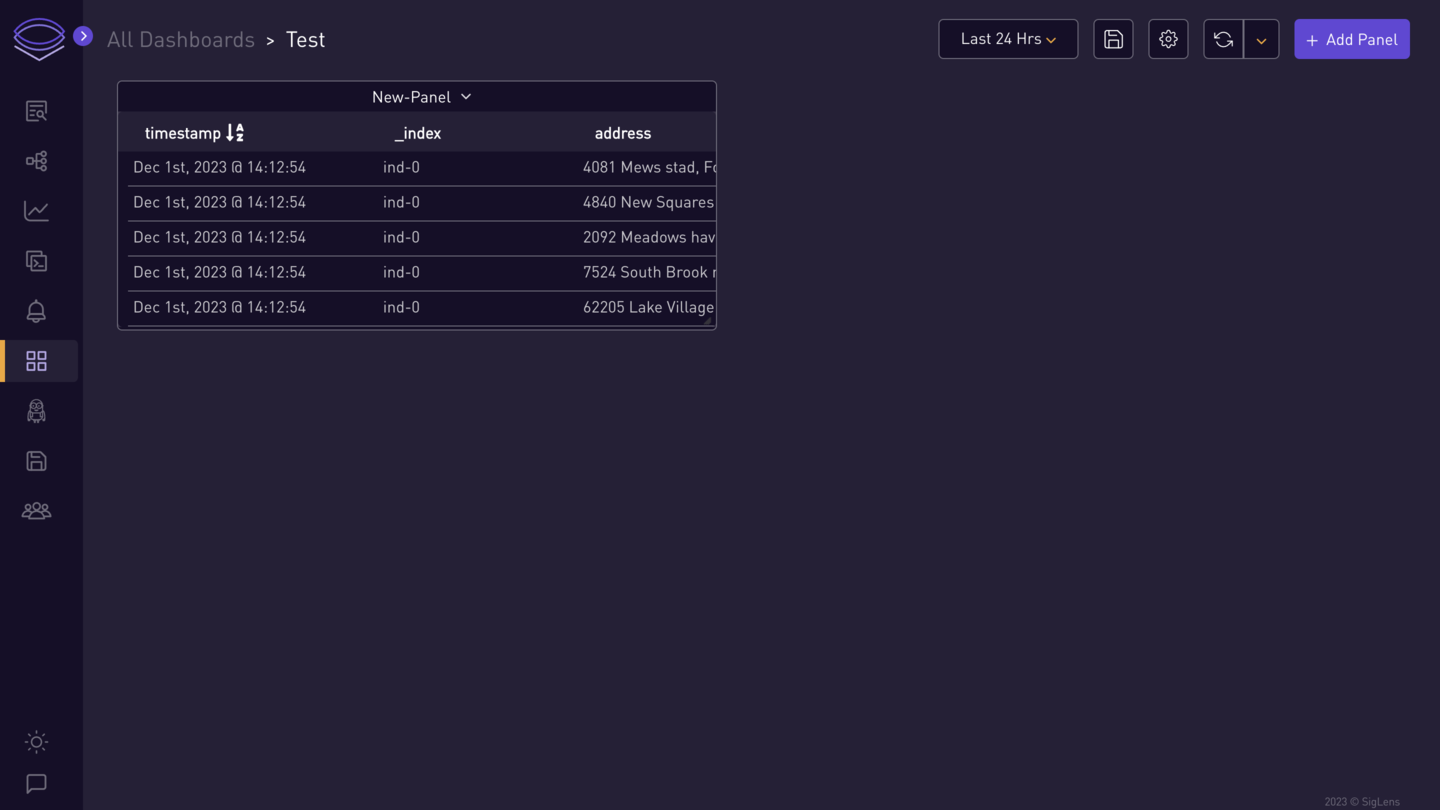
⭐ Adding Panel to Dashboard ⭐
Demonstration for adding a panel
-
Add Panel to Dashboard:
-
Enter a query in the search bar and select the option next to the downloads option to add the panel to the dashboard.
-
-
Panel Options:
-
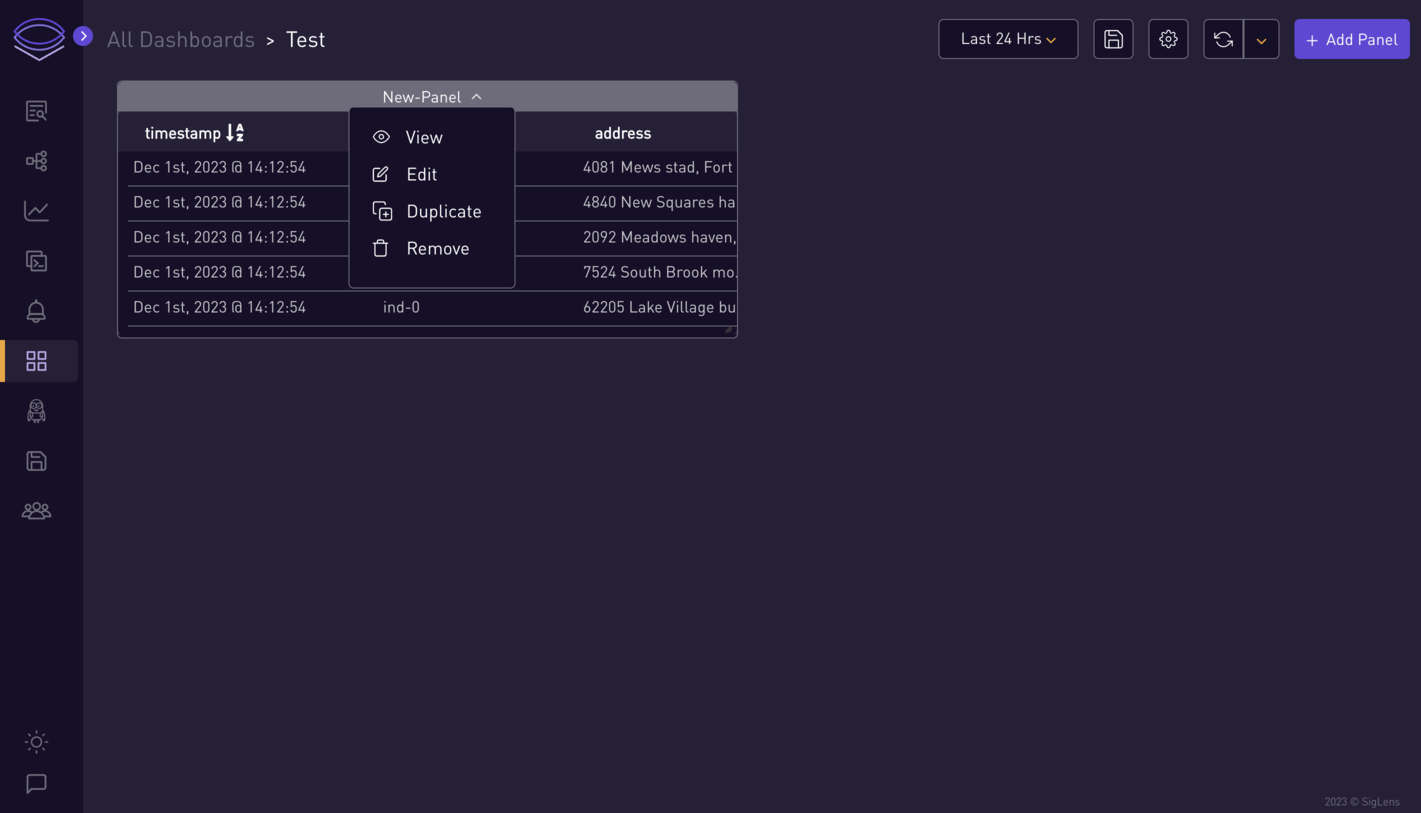
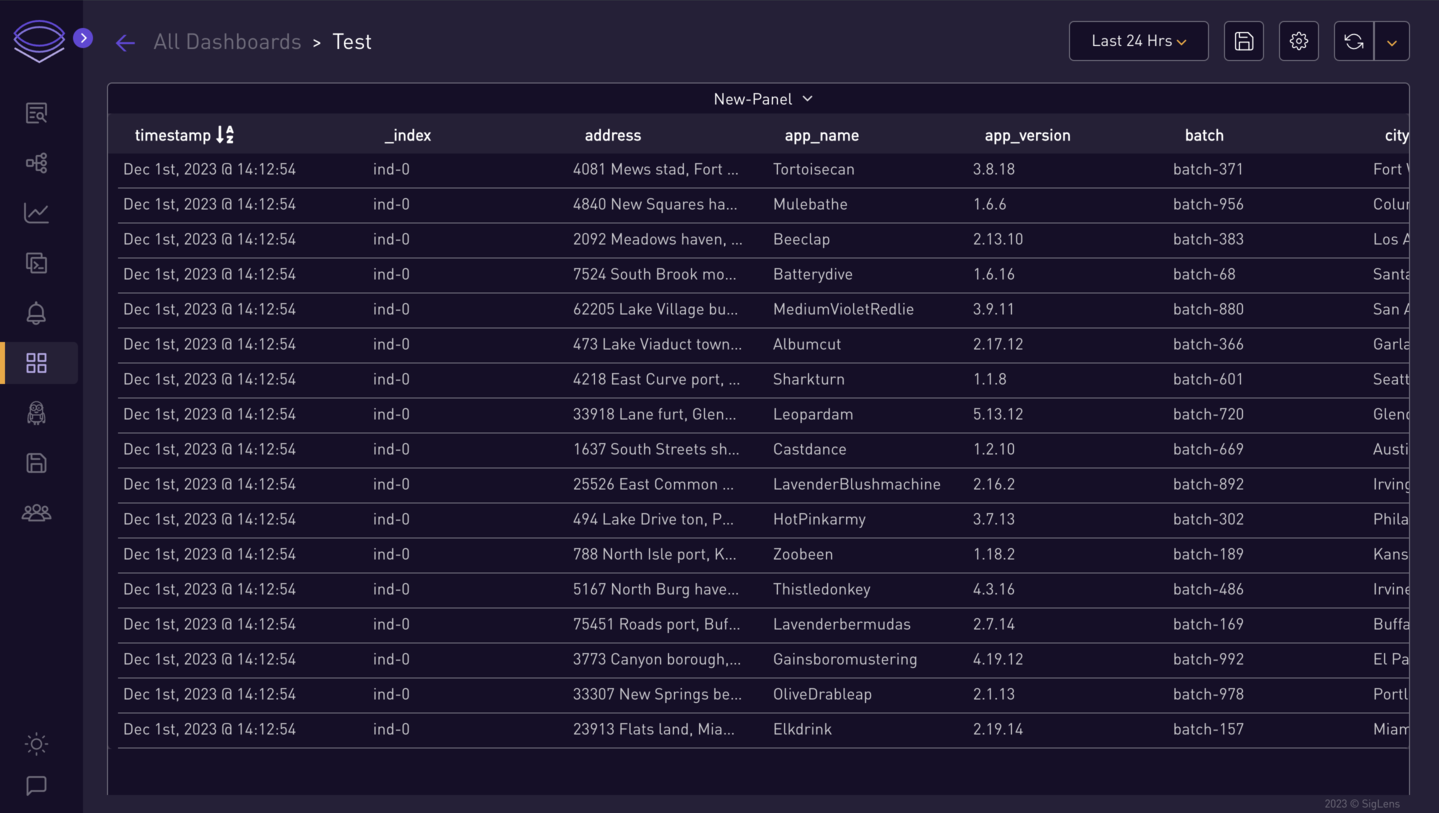
You can view, edit, duplicate, and remove the panel.
-