Cluster Health
Cluster Stats Dashboard 📊
Welcome to the Cluster Stats Dashboard. To view the cluster stats you have to ingest the data.
You can ingest test data:
⭐ Features Overview ⭐
- Real-Time Event Monitoring: Track the event count and volume in real-time.
- Log Statistics: Get a detailed breakdown of logs by index name, incoming volume, and event count.
- Metrics Analysis: Analyze metrics for system performance and efficiency.
- Query Statistics: Monitor the performance of your queries with average latency and count.
⭐ Dashboard Sections ⭐
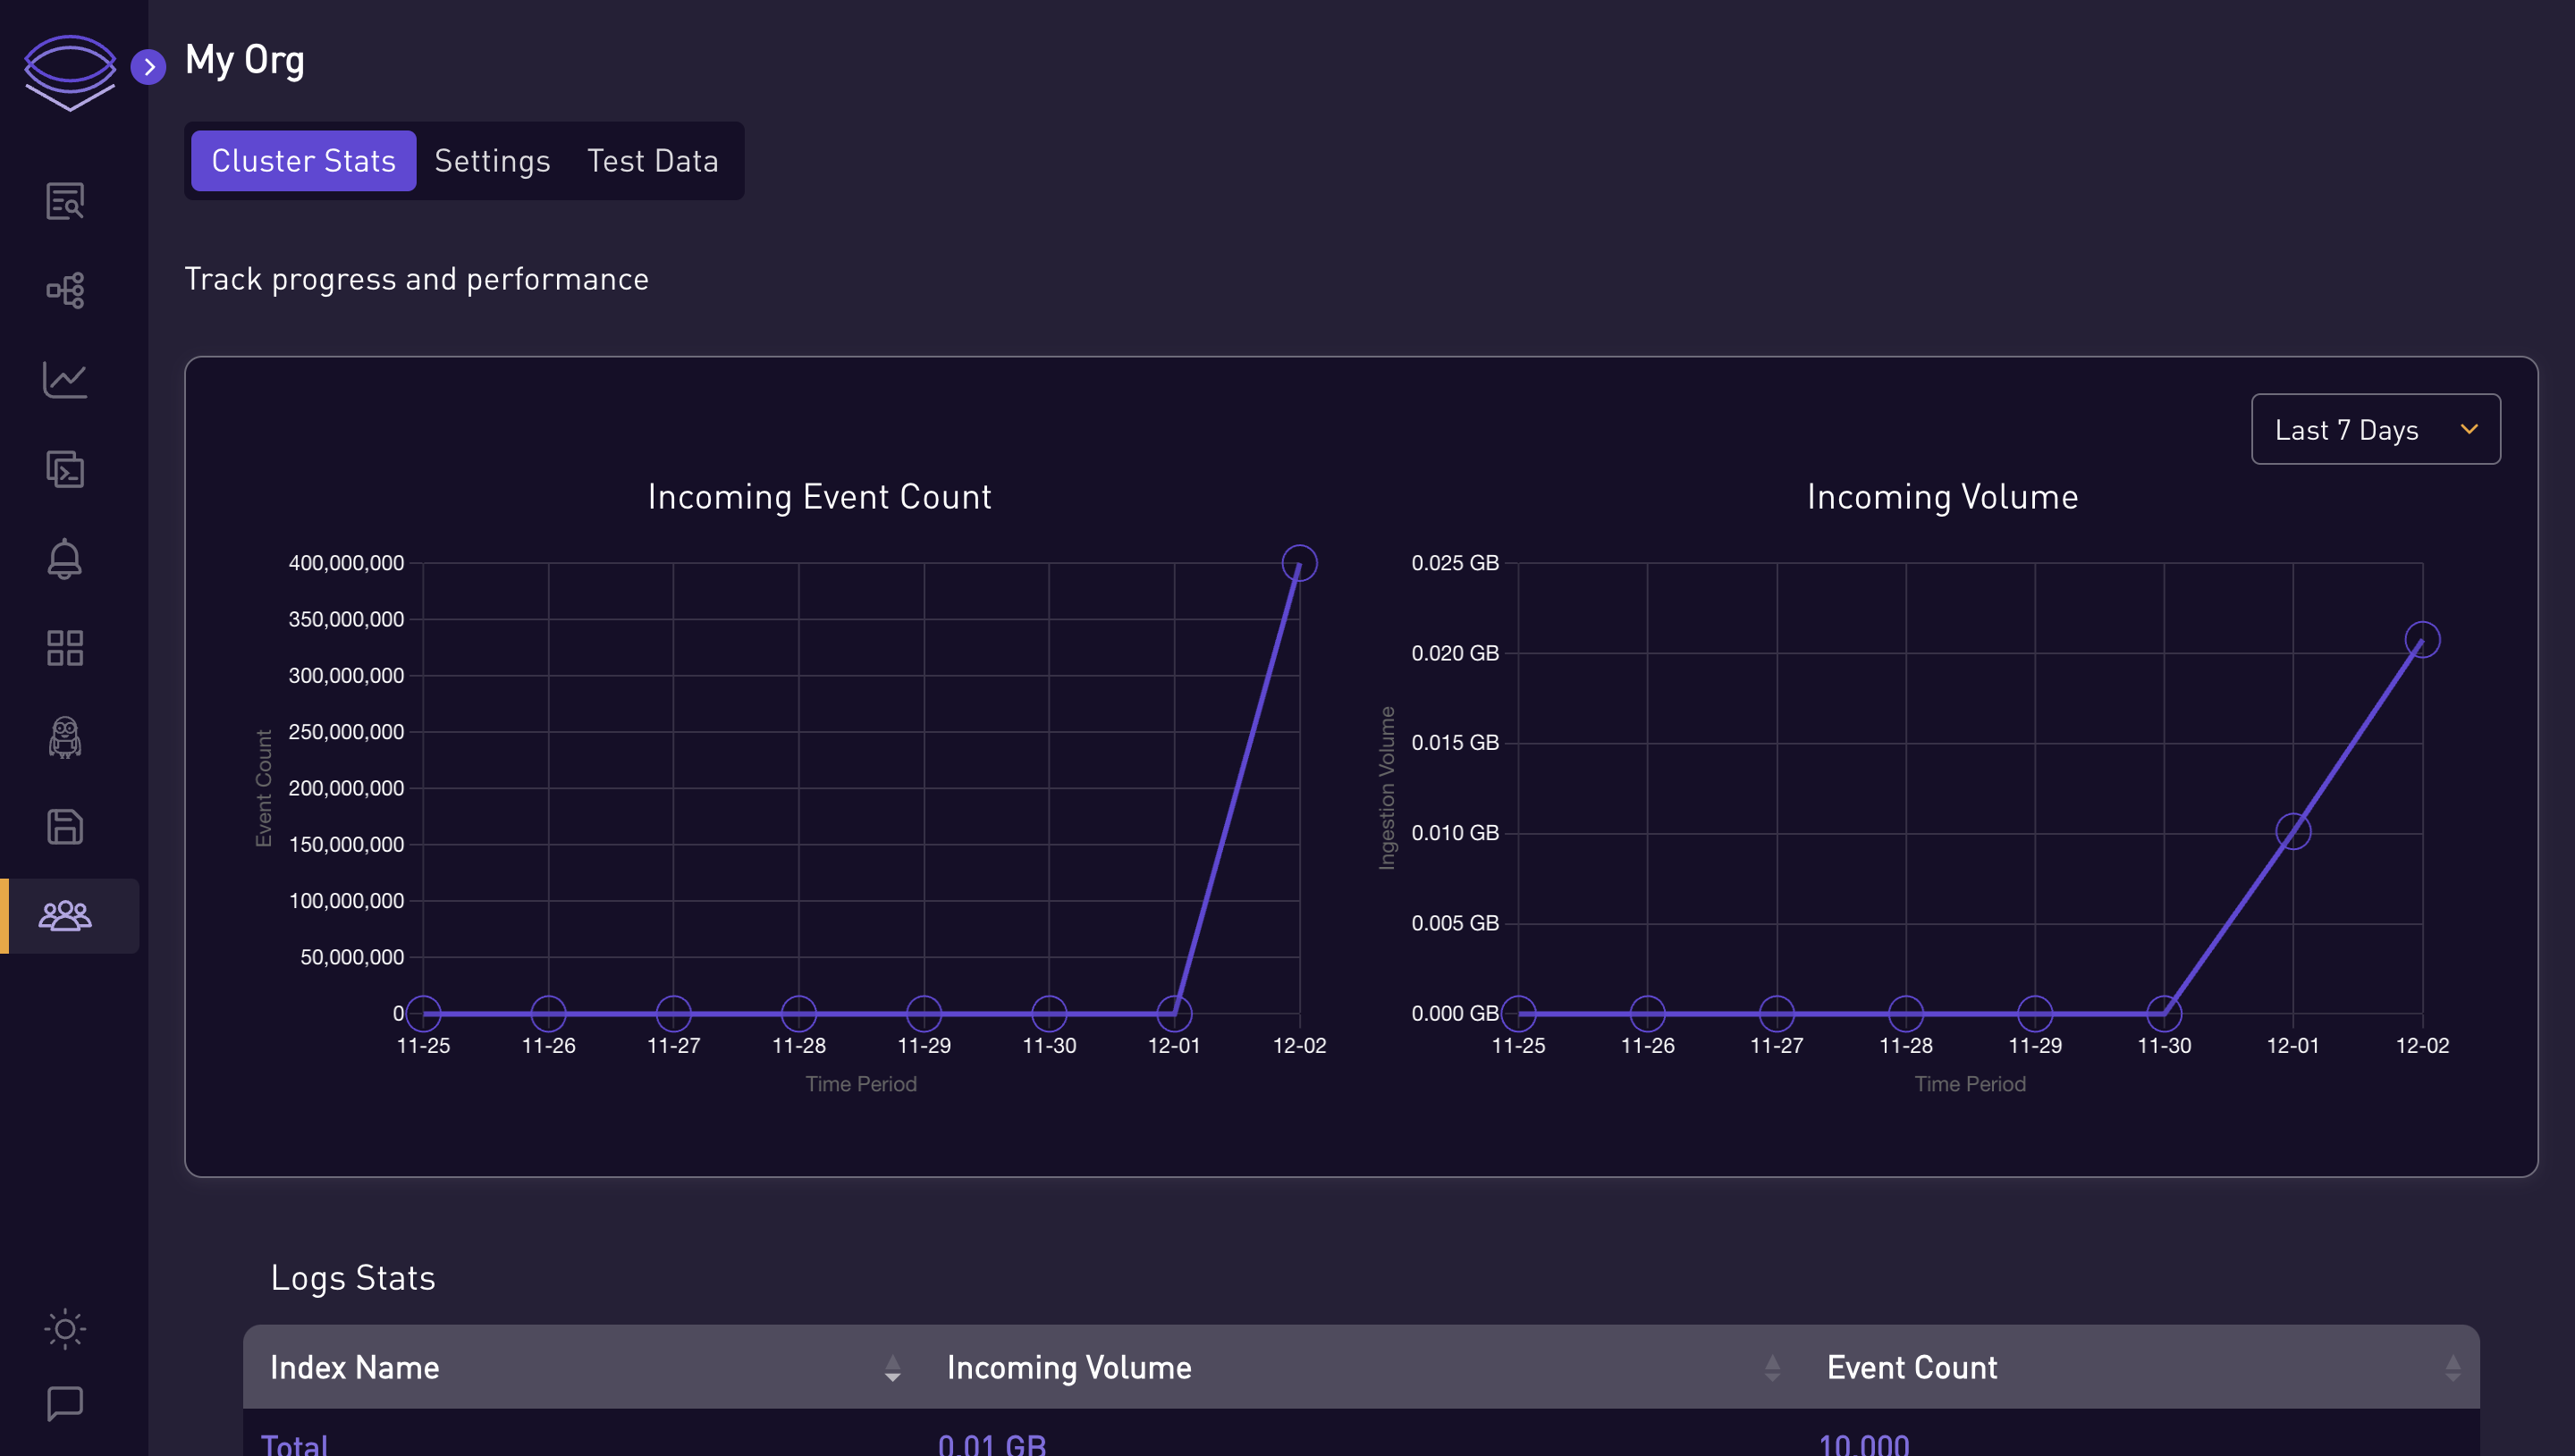
Incoming Event Count & Volume 🚀
-
Chart 1: Displays the incoming event count over time, allowing you to monitor the flow of events into your system.
-
Chart 2: Shows the incoming data volume, providing insight into the data throughput within the specified time frame.

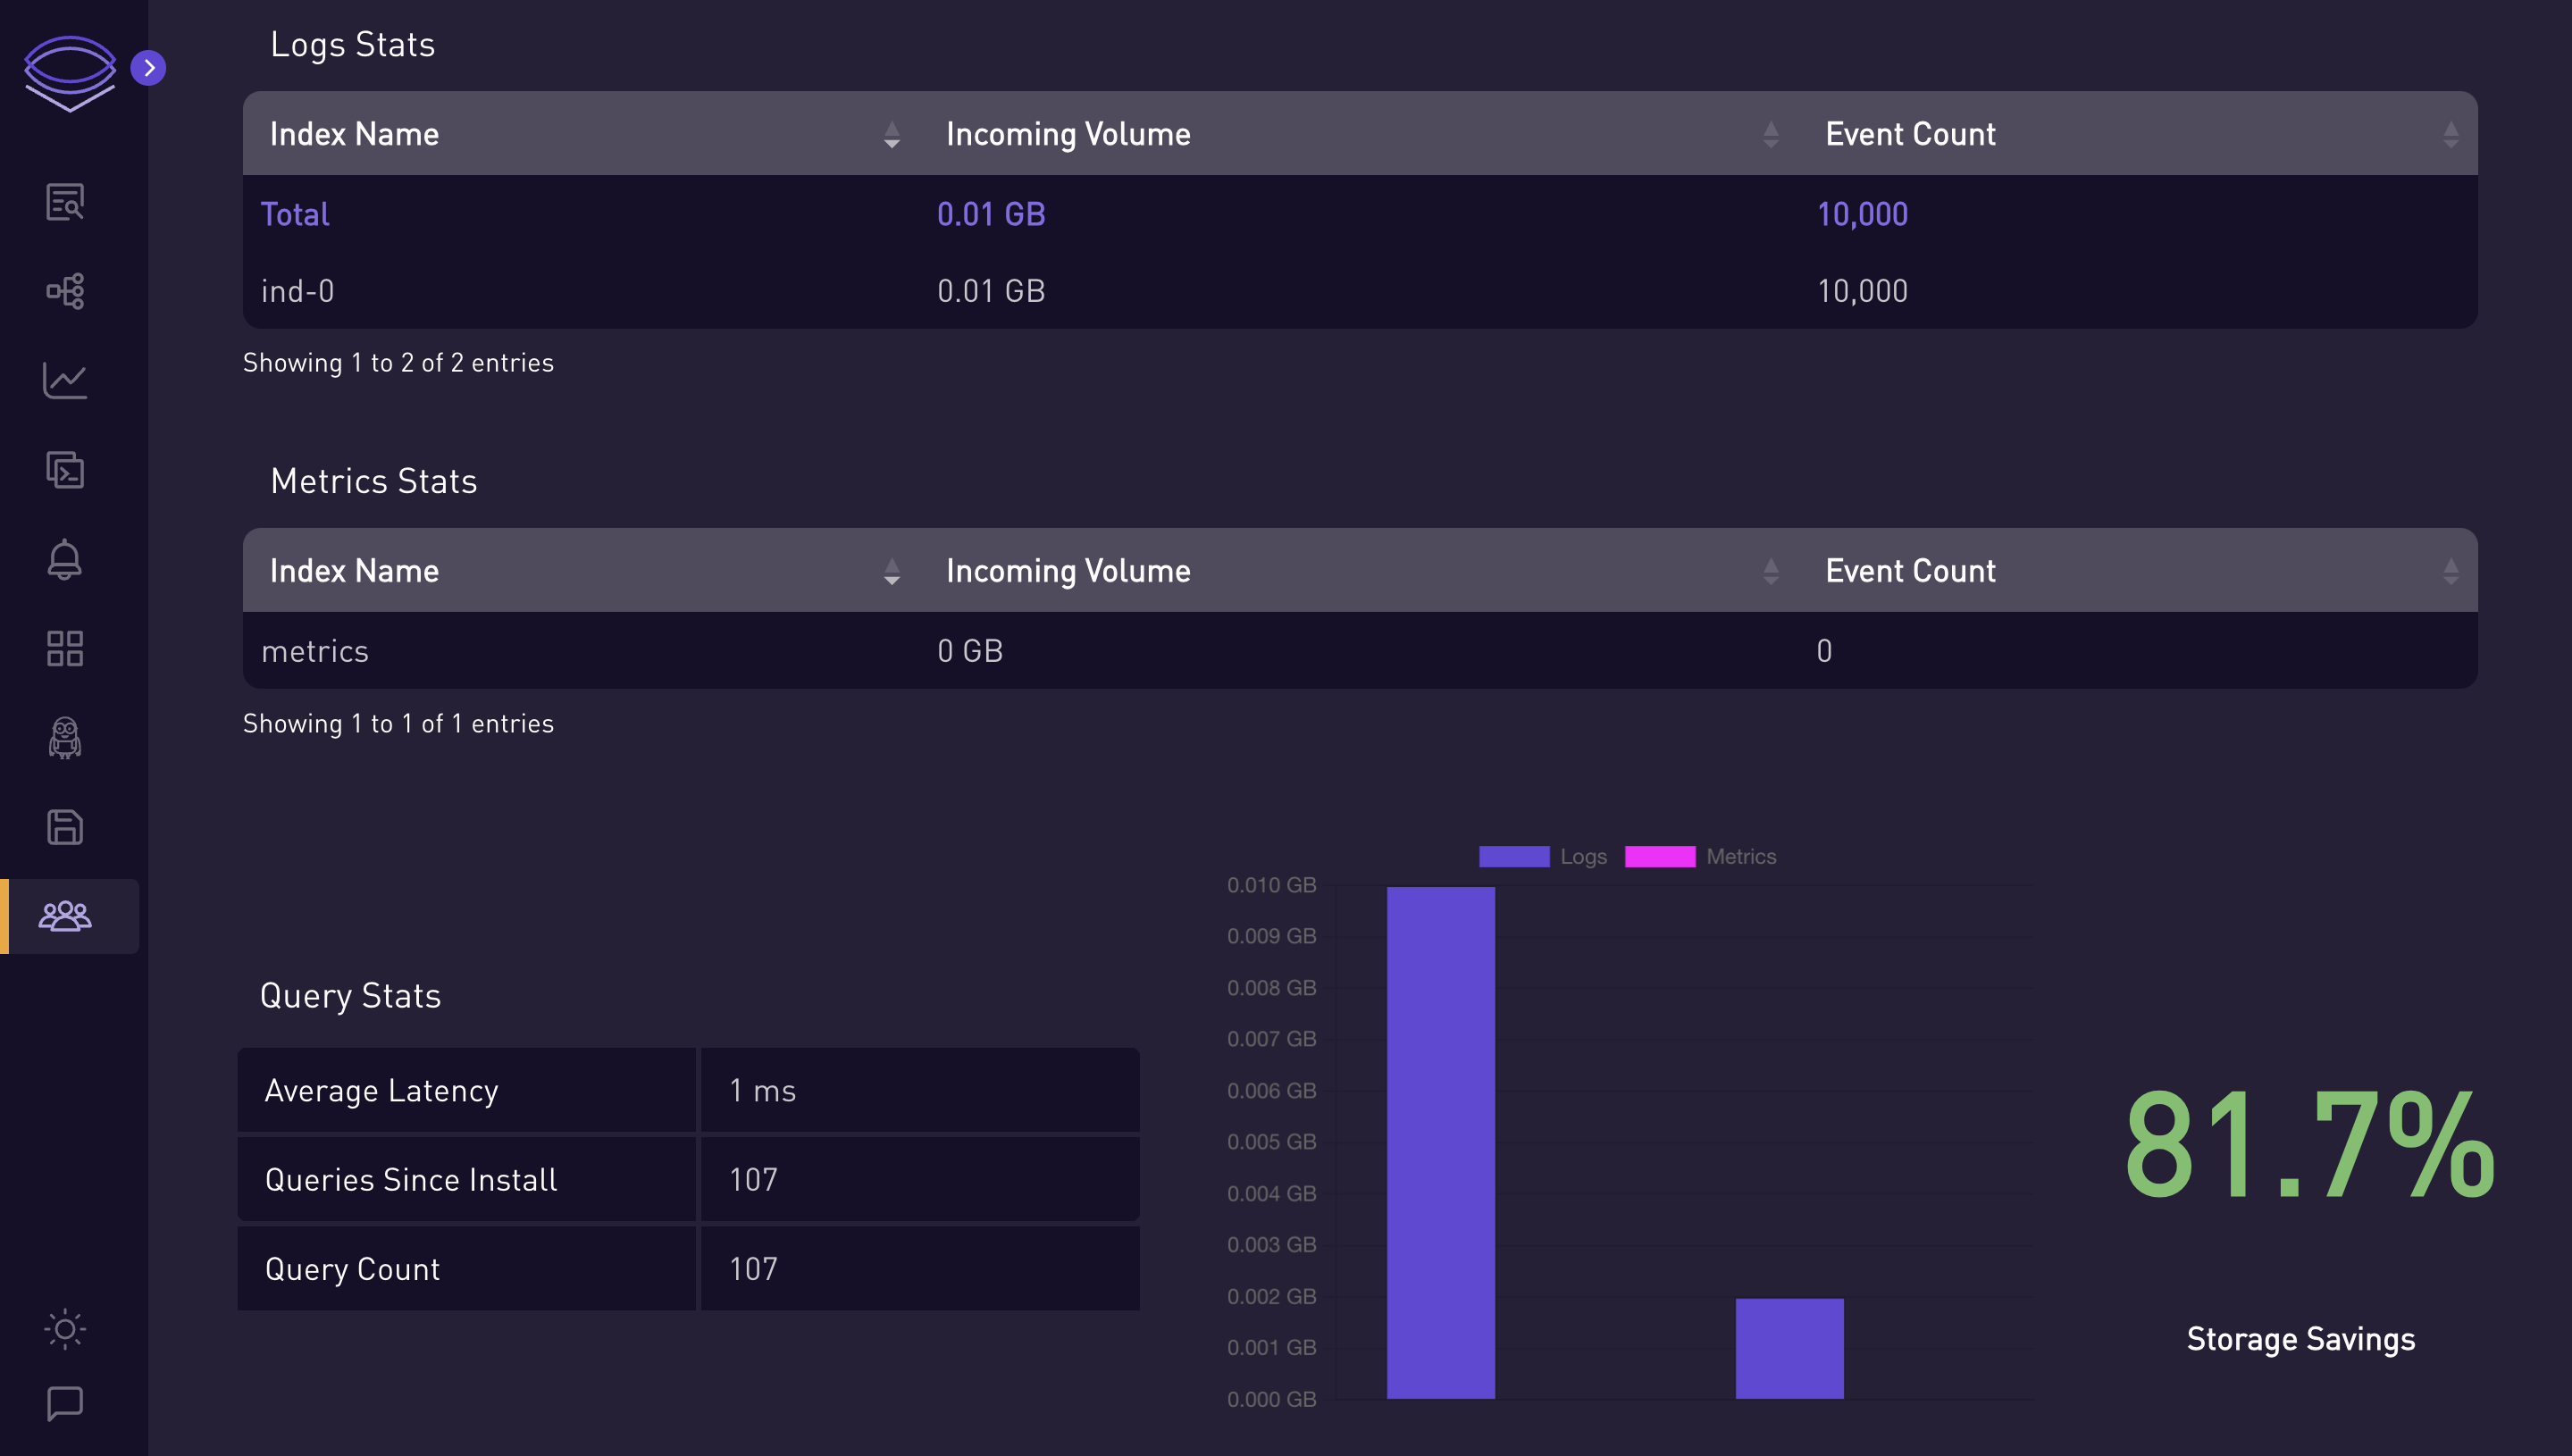
Logs, Metrics, Query Stats 📈
-
Table 1: Presents a summary of logs, detailing the index names along with their respective incoming volume and event count.
-
Table 2: Presents a summary of metrics, detailing the index names along with their respective incoming volume and event count.
-
Table 3: Focuses on query performance, with statistics on average latency and total query count and queries since install
-
Storage Savings: Highlights the storage savings achieved for cost-effective storage management.
